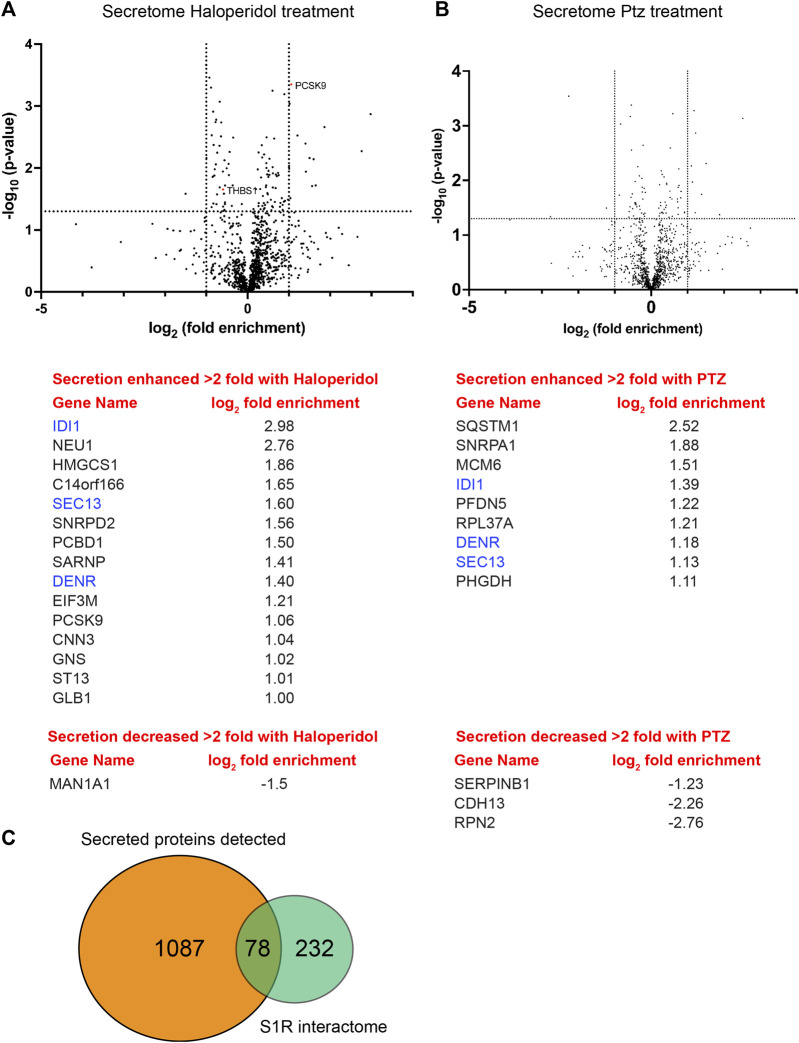
FIGURE 7.
Global secretome analysis upon ligand treatment. (A) A volcano plot comparing the secretome between control cells versus cells treated with 25uM Haloperidol for 24 h. A line demarcating 2-fold enrichment (+1 and −1 on the x-axis) and a p-value of 0.05 is shown (1.3 on the y-axis). A list of proteins whose secretion is affected greater than two fold is shown below the volcano plot. (B) A volcano plot comparing the secretome between control cells versus cells treated with 20uM (+)-PTZ for 24 h. The layout is similar to panel (A). The proteins in blue were shown to be affected in their secretion under both treatment conditions. (C) A pie chart showing the total number of secreted proteins, the number of proteins found to be biotinylated by S1R-Apex, and the overlap between the two categories.

