Fig. 4.

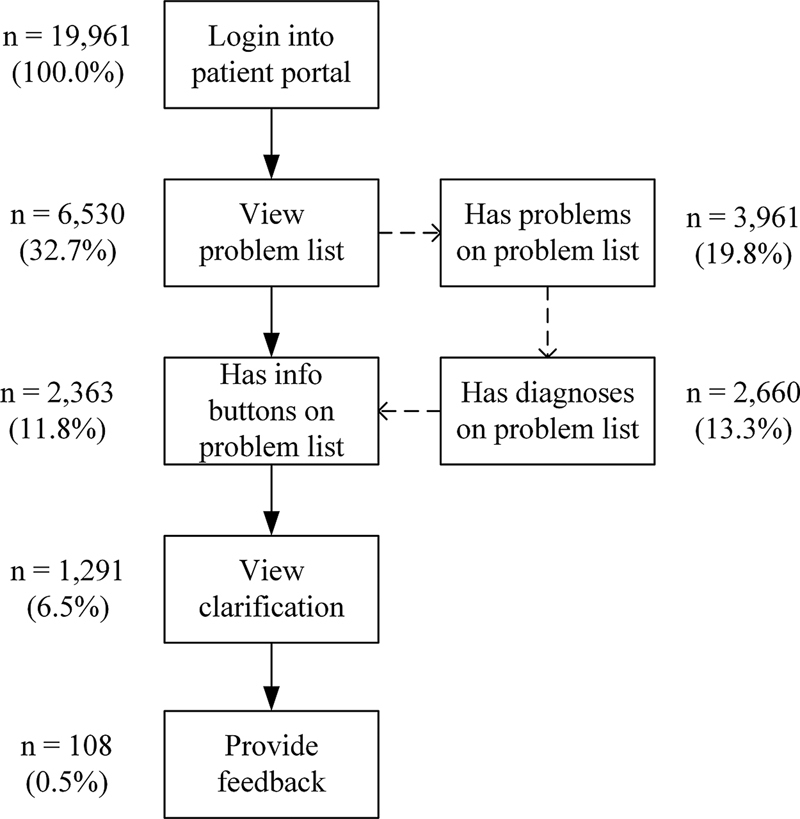
The number and percentage (conversion rates) of patients for whom users went through the conversion steps. Not all patients had problems, diagnoses, or info buttons on their problem list, which is illustrated with the dashed arrows.

The number and percentage (conversion rates) of patients for whom users went through the conversion steps. Not all patients had problems, diagnoses, or info buttons on their problem list, which is illustrated with the dashed arrows.