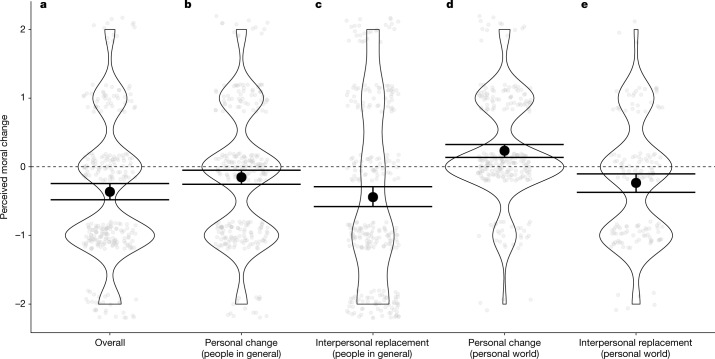
Fig. 3. Results of study 5a.
a–e, From left to right, this figure shows the perceived difference in morality of (a) people in general in 2005 and people in general in 2020 (overall) (b), people in general who were sampled both in 2005 and 2020 (personal change among people in general) (c), people in general who were sampled in 2005 or 2020 but not in both years (interpersonal replacement among people in general) (d), people in the participant’s personal world who were sampled both in 2005 and 2020 (personal change among people in personal world) and (e) people in the participant’s personal world who were sampled in 2005 or 2020 but not in both years (interpersonal replacement among people in participant’s personal world). Opaque points represent means. Transparent points represent individual observations jittered for legibility. Error bars represent 95% CIs. n = 283.

