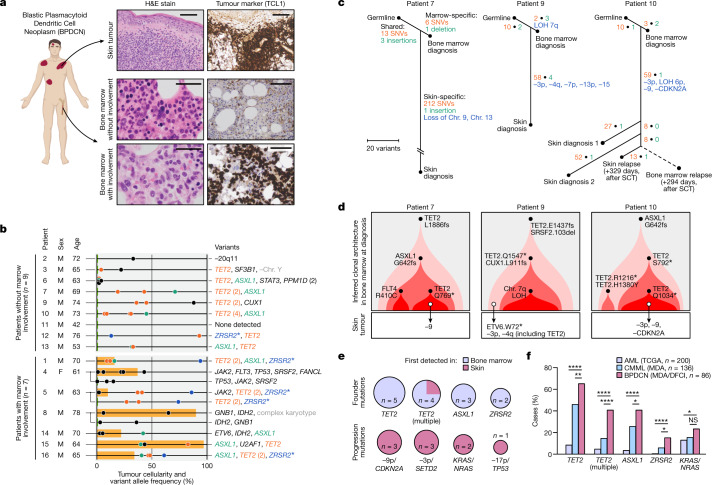
Fig. 1. Phylogenomics of BPDCN across tissues.
a, Skin tumour (top) from a representative patient with BPDCN showing infiltration by malignant cells (haematoxylin and eosin (H&E), left) expressing the pDC marker TCL1 (immunohistochemistry, right). Marrow can show normal haematopoiesis (middle) or involvement by malignant cells (bottom). Scale bars, 200 μm (top), 100 μm (middle right and bottom right), 50 μm (middle left and bottom left). b, Mutated genes identified by targeted sequencing of marrow samples from 16 patients with BPDCN, including nine without marrow involvement (top; limit of detection, 5%) and seven with involvement (bottom; the orange bars indicate tumour cellularity). Gene labels are ordered from left to right from low to high VAF (x axis). The parentheses indicate multiple mutations in one gene. Recurrent gene mutations (≥3 patients) are indicated in colour. The asterisks indicate genes on chromosome (Chr.) X. c, Tumour phylogenies for patients 7, 9 and 10. Single-nucleotide variants (SNVs) (red), insertions/deletions (green) and copy-number alterations (blue, minus symbol represents chromosome or arm losses) are indicated (Methods). The dashed line indicates a post-transplant sample for which new alterations could not be detected owing to donor SNVs. SCT, stem cell transplant. d, Inferred clonal architecture in marrow samples for patients in c. Subclones directly related to BPDCN skin tumours are indicated by arrows, and are further annotated with skin-specific progression mutations. e, The frequency of mutations first detected in marrow (founder mutations, top) or skin tumours (progression mutations, bottom) for patients in c and Extended Data Fig. 1d,e. n values indicate the number of gene mutations across the five patients. f, The frequency of mutations in founder and progression genes in BPDCN, CMML and AML. Statistical significance was determined using two-sided Fisher’s exact tests. DFCI, Dana-Farber Cancer Institute; MDA, MD Anderson Cancer Center; TCGA, The Cancer Genome Atlas. *P < 0.05, **P < 0.01, ****P < 0.0001; NS, not significant. The diagram in a was created using BioRender.

