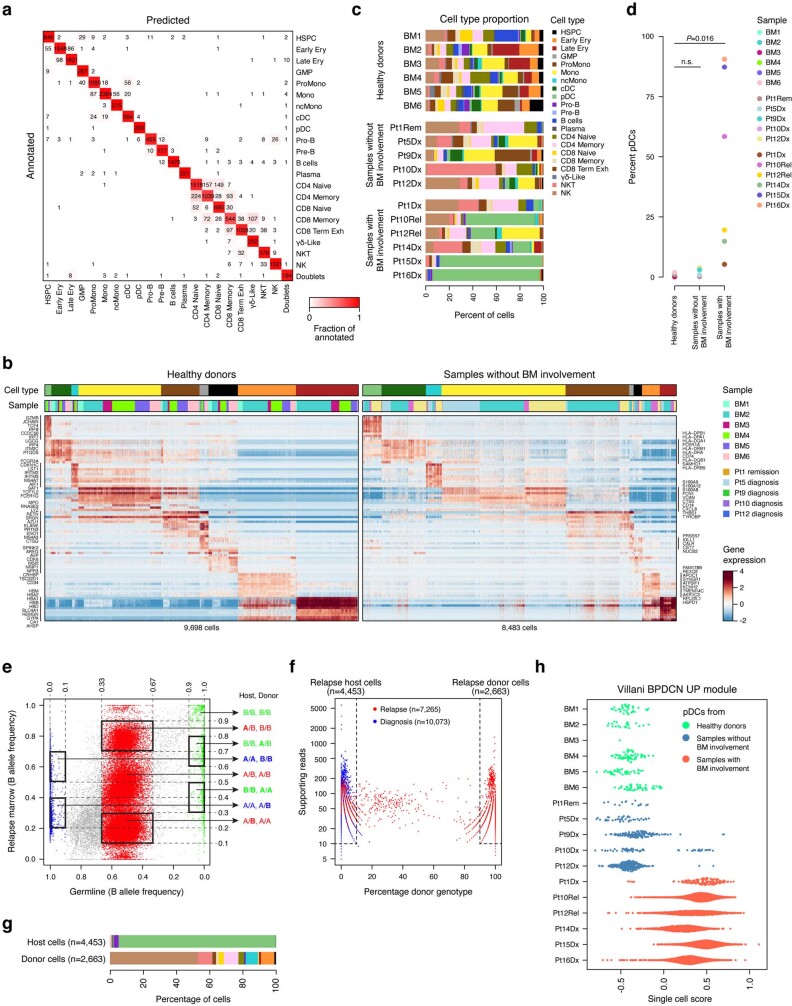
Extended Data Fig. 5. Single-cell transcriptome analysis of healthy donor and BPDCN patient bone marrow samples.
a, Heatmap depicts five-fold cross validation of the random forest classifier comprising 22 classes corresponding to the cell types identified in healthy bone marrow samples (including inferred cell doublets). The healthy donor cells were split such that 80% were used as a reference to predict the classification of the remaining 20%. This process was repeated five times. Cells that fall on the diagonal are classified according to their annotation. Cells that do not fall on the diagonal are mis-classified as a different cell type. b, Heatmaps show expression of known marker genes (rows) in cells (columns) of the myeloid and erythroid differentiation trajectories in bone marrow samples from healthy donors (left) and from BPDCN patients without known bone marrow involvement (right). Top annotation bars show cell types (colour legend provided in panel c) and sample identity. c, Barplot shows the proportion of cell types within each of the 17 analysed single-cell samples. Healthy donor cells were annotated by clustering and assessment of marker gene expression. Patient cells were annotated using the random forest classifier, using healthy donors as a reference. The high proportion of T cells in Patient 10 was consistent with flow cytometry. d, Dot plot shows percent of cells classified as pDCs in each healthy donor and patient sample. High percentage of pDCs in samples with known marrow involvement reflects malignant BPDCN cells. Data is shown for all samples that were analysed by scRNA-seq (n = 6 healthy donors, n = 5 samples without known marrow involvement, and n = 6 samples with marrow involvement). Statistical significance between sample groups is indicated (two-sided Student’s t-test). e, Scatterplot shows B (minor) allele frequencies of Patient 10 SNVs in relapse bone marrow sample (post allogeneic stem cell transplant, y-axis) and germline sample (x-axis). SNVs homozygous in the host germline sample are indicated in blue (A/A) and green (B/B), heterozygous SNVs are indicated in red (A/B). This analysis allows for the identification of alleles that are specific for host and donor cells (indicated in bold). Thresholds that were used for subsetting these SNVs are indicated. f, Scatterplot shows quantification of host- and donor-specific alleles in the scRNA-seq data of Patient 10 relapse bone marrow samples (red). The fraction of SNVs specific to the donor genome is indicated on the x-axis. Genotypes could be assigned for the majority of cells (98.0%), with 62.6% of those annotated as host-derived, and 37.4% annotated as donor-derived. Cells from the diagnostic bone marrow sample (blue), for which no cells were annotated as donor-derived, are shown as comparison. g, Barplot shows the proportion of cell types within Patient 10 relapse cells genotyped as host- and donor-derived. Most host cells classify as pDCs, likely reflecting malignant BPDCN cells. h, Violin plot shows scores of a published BPDCN gene signature for pDCs from each of the 17 analysed single-cell samples. Related to Fig. 2.

