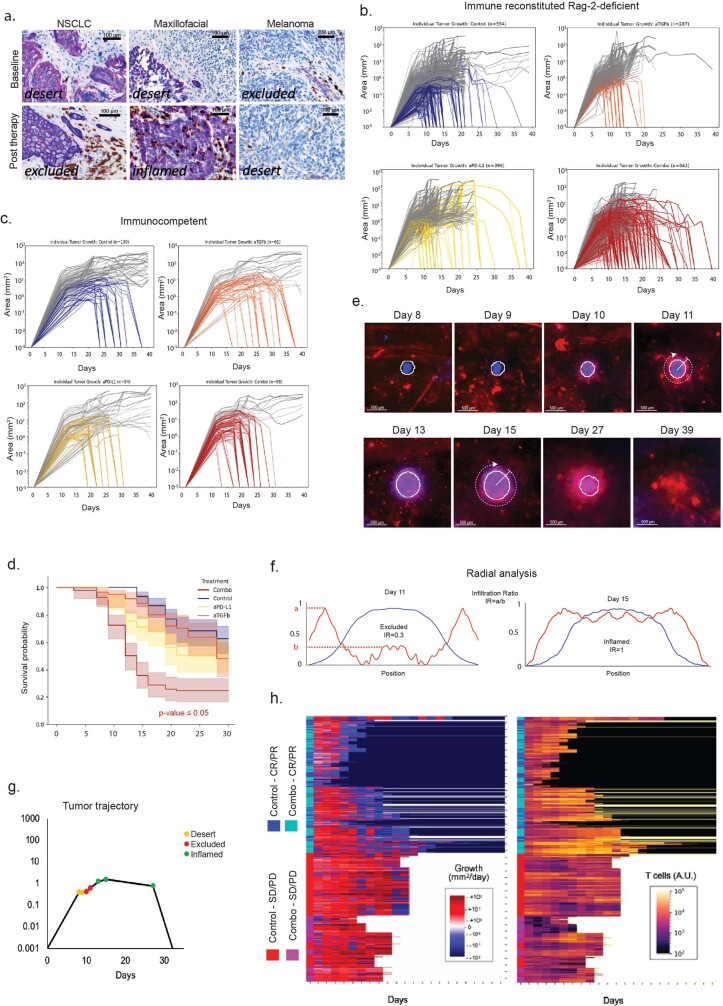
Extended Data Fig. 9. Early transition to an inflamed phenotype predicts tumour response to immunotherapy.
a, Histology of patient paired tumour biopsies at baseline and at progression after treatment with checkpoint blockade. CD8 staining in brown, pan-cytokeratin staining in magenta. b, Individual tumour growth kinetics of KPP-GFP STAMP tumours for experiment with immune reconstituted animals described in Fig. 4a. c-d, STAMP arrays of KPP-EGFP were implanted in immunocompetent animals and treated 10 days post-implantation with isotype control antibodies (n = 130 tumours, 4 animals), anti–PD-L1 (n = 94 tumours, 4 animals), anti–TGF-β (n = 61 tumours, 3 animals) or a combination of anti–PD-L1 with anti–TGF-β (n = 99 tumours, 4 animals). c, Individual tumour growth kinetics (mm2) shown with coloured lines to indicate tumours that are rejected and grey lines to indicate tumours that persist. d, Survival probability of individual tumours described for c and d. The centre line shows the Kaplan-Meier curve, the shaded area shows the 95% confidence interval. Statistical analysis was performed with log-rank test. P value is shown in the graph and colour-coded for the treatment group. e, Image series of individual STAMP tumour over time. Red = T cells, blue = tumour cells. f, Quantification of median radial fluorescence profile for individual tumour shown in e to distinguish non-desert, T cell excluded phenotype (low T cell infiltration ratio, day 11) and T cell inflamed phenotype (high T cell infiltration ratio, day 15). g, Overlay of the automated classification of immune phenotypes with the individual tumour growth curve for the example in e. h, Hierarchical clustering of individual tumour immune growth rates (left) and T cell infiltration (right) for isotype control treated tumours and combo anti–PD-L1/anti–TGF-β treated tumours as described in Fig. 4a. Black = tumour resolved, white = mouse death/euthanasia. Cyan=combination treated responders (C.R. + P.R.), magenta = combination treated non-responders (S.D. + P.D.), blue = Control responders (C.R.+ P.R.), red = control non-responders (S.D. + P.D.).

