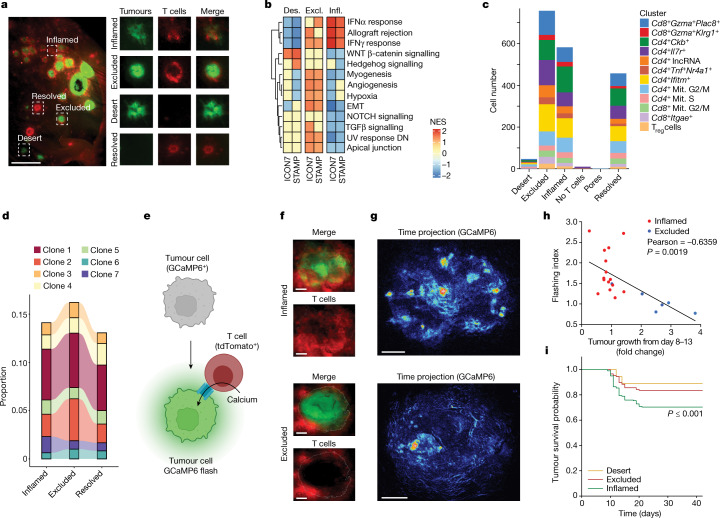
Fig. 2. Immune-inflamed phenotype supports T cell effector function and tumour rejection.
a, Representative image of a STAMP array of KPP-eGFP tumours at 8 days after tumour implantation in RAG2-deficient mice, reconstituted with tdTomato+ T cells. n = 50 mice, n = 10 independent experiments. Red, T cells; green, KPP-eGFP cells. Left, representation of the entire ear. Right, magnified images of individual tumours with different immune phenotypes. Scale bar, 2 mm. b, Heat map comparing the normalized enrichment scores for pathways that are significantly enriched across the immune-inflamed (infl.), immune-desert (des.) and immune-excluded (excl.) phenotypes from either human tumours from the ICON7 clinical trial or mouse STAMP tumours. Normalized enrichment scores were determined using clusterProfiler::GSEA using the false-discovery rate P-value adjustment method; Padj < 0.2 was considered to be significant. c, The abundance of T cell subsets was determined using scRNA-seq analysis of STAMP tumour biopsies pooled by immune phenotype. Treg cells, regulatory T cells. Mit., mitotic. d, The relative abundance of seven dominant T cell clonotypes across immune phenotypes. e, Schematic of cytotoxic T cell attack creating calcium-permeable pores in the tumour cell membrane, which triggers green fluorescence of the GCaMP6 calcium sensor in the tumour cell. f, Representative images of KPP-mTagBFP2-GCaMP6 STAMP tumours with the inflamed (top) or excluded (bottom) immune phenotype. n = 6 tumours. Red, T cells; green, GCaMP6. g, Time projection GCaMP6 fluorescent flashes of the tumour described in f. h, Correlation analysis of the GCaMP6 flashing index at 8 days after tumour implantation and the tumour growth fold change between day 8 and day 13 for immune-inflamed and immune-excluded tumours described in f. Pearson correlation was computed assuming a normal distribution. Statistical analysis was performed using two-tailed t-tests. i, Kaplan–Meier curve showing the survival probability of individual tumours of KPP-eGFP arrays that were immune phenotyped as immune-desert, immune-excluded or immune-inflamed by imaging 8 days after tumour implantation. n = 632 tumours, n = 10 mice. Statistical analysis was performed using a log-rank test (referenced to excluded tumours). For f and g, scale bars, 100 μm (inflamed) and 200 μm (excluded).

