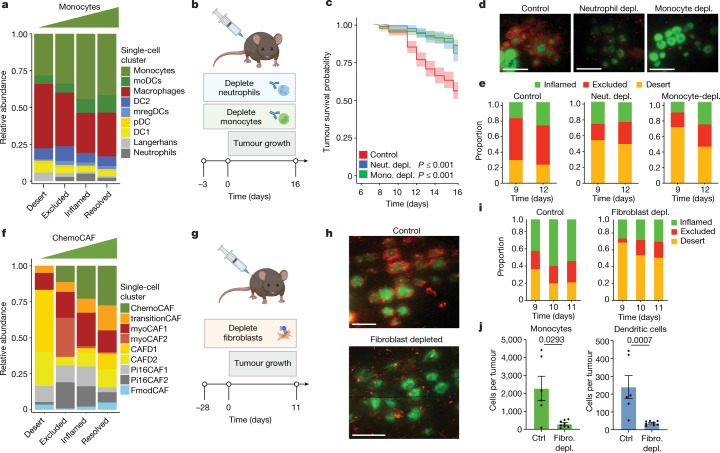
Fig. 3. Myeloid and stromal cells control TIP and tumour fate.
a, The relative abundance of myeloid cell subclusters as determined by scRNA-seq analysis of STAMP tumour biopsies pooled by immune phenotype. DCs, dendritic cells; moDCs, monocyte-derived dendritic cells; mregDCs, mature DCs with immunoregulatory molecules; pDCs, plasmacytoid dendritic cells. b, The experimental design relating to c–e. Neutrophils or monocytes were ablated using depleting antibodies (Gr1 or Ly6C, respectively) beginning 3 days before STAMP implantation of KPP-eGFP tumour arrays in E8I CD8-cre LSL-tdTomato immunocompetent mice. n = 6 isotype-control-treated mice, n = 319 tumours; n = 5 neutrophil-depleted (neut. depl.) mice, n = 187 tumours; n = 5 monocyte-depleted (mono. depl.) mice, n = 301 tumours. c, The survival probability of individual tumours of KPP-eGFP arrays related to b. The centre line shows the Kaplan–Meier curve and the shaded area shows the 95% confidence interval. Statistical analysis was performed using log-rank tests (referenced to the isotype control). d, Representative image of STAMP tumour arrays of non-depleted (left) neutrophil-depleted (middle) or monocyte-depleted (right) mice related to b at 11 days after tumour implantation. Red, T cells; green, KPP-eGFP. Scale bars, 2 mm. e, The proportion of immune-inflamed, immune-excluded and immune-desert tumours related to b–d. f, The relative abundance of fibroblast subclusters determined by scRNA-seq analysis of STAMP tumour biopsies pooled by immune phenotype. g, The experimental design relating to h–j. DPT+ fibroblasts were ablated by tamoxifen and diphtheria toxin administration in Dpt-cre-ERT2 LSL-DTR mice before STAMP implantation of KPP-eGFP tumour arrays into mice reconstituted with tdTomato+ T cells. n = 5 control mice, n = 207 tumours; n = 7 fibroblast-depleted mice, n = 314 tumours. h, Representative image of STAMP tumour arrays of control (top) or fibroblast-depleted (bottom) mice at 11 days after tumour implantation. Red, T cells; green, KPP-eGFP. Scale bars, 1 mm. i, The proportion of Immune-inflamed, immune-excluded and immune-desert tumours related to g. j, Flow-cytometry-based monocyte and dendritic cell profiling of tumours in fibroblast-depleted versus control non-depleted mice related to g. Data are mean ± s.e.m. Statistical analysis was performed using a two-tailed Mann–Whitney U-test.

