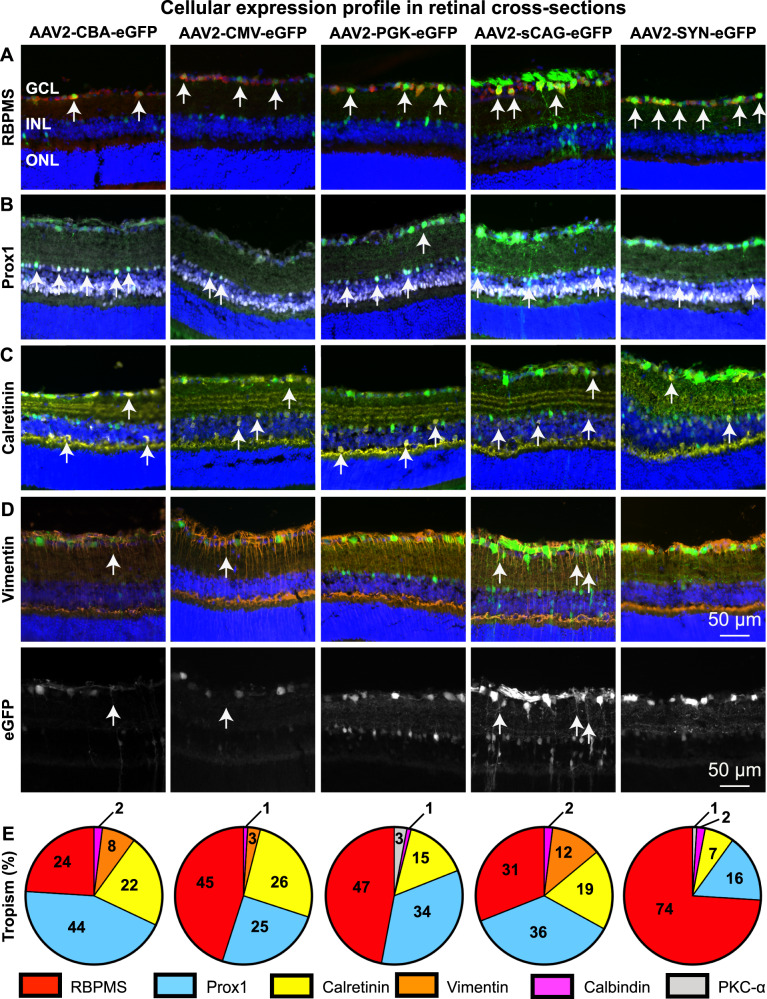
Fig. 5. The cellular expression profile in the mouse retina after intravitreal injection of AAV2 and five promoters.
eGFP expression (green) and DAPI staining (blue) together with RBPMS (A, red), Prox1 (B, cyan), Calretinin (C, yellow), and Vimentin (D, orange) staining in retinal cross-sections of mice that were intravitreal injected with AAV2-CBA-eGFP, AAV2-CMV-eGFP, AAV2-PGK-eGFP, AAV2-sCAG-eGFP, and AAV2-SYN-eGFP. E Quantification of the cellular tropism by each promoter expressed as a percentage of all transduced cells assessed. Two eyes, each from a different mouse, were analysed for each promoter. Images were taken using an epifluorescent microscope with identical microscope settings between the experimental groups per investigated cell-type. eGFP is shown throughout without amplification using a GFP antibody. GCL ganglion cell layer, INL inner nuclear layer, ONL outer nuclear layer.

