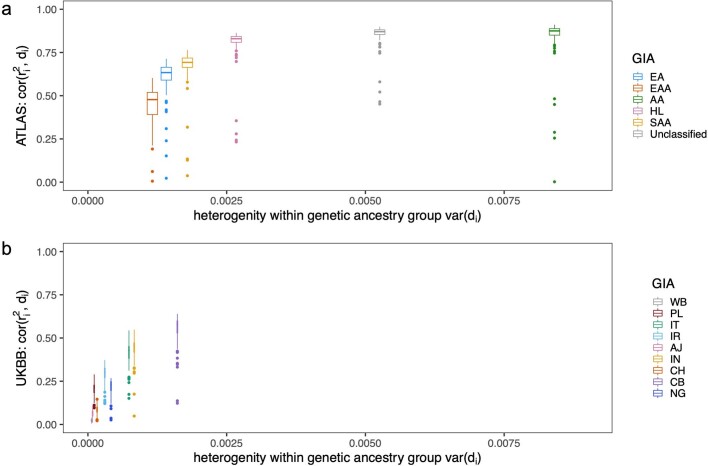
Extended Data Fig. 6. Lower heterogeneity within the genetic ancestry group corresponds to a lower correlation between genetic distance and individual PGS accuracy.
(a) The distribution of correlations between PGS accuracy and GD for 84 traits in ATLAS. (b) The distribution of correlations between PGS accuracy and GD for 84 traits in UKBB. The x-axis is the homogeneity of the genetic ancestry clusters measured as the variance of GD within a genetic ancestry cluster; a larger indicates a larger variation of genetic background. Each boxplot contains 84 points corresponding to the correlation between PGS accuracy and GD within the group specified by x-axis for each of the 84 traits. The box shows the first, second and third quartile of the 84 correlations, and whiskers extend to the minimum and maximum estimates located within 1.5 × IQR from the first and third quartiles, respectively.

