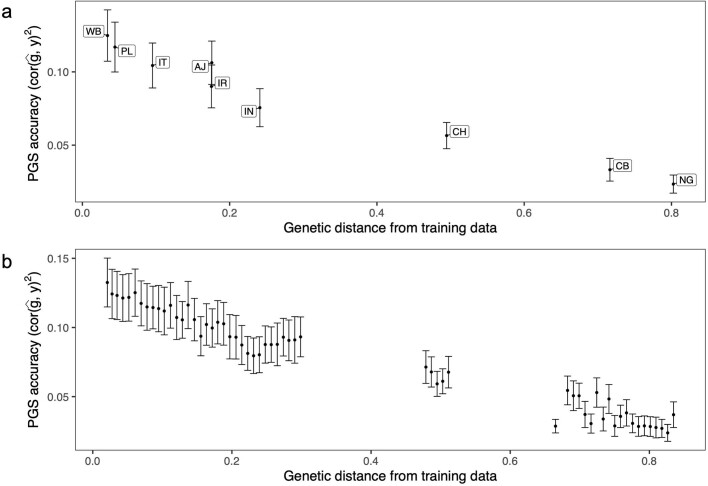
Extended Data Fig. 7. Empirical PGS accuracy decreases with genetic distance in UKBB averaged across 84 traits.
(a) Empirical PGS accuracy decreases across subcontinental GIA clusters. (b) Empirical PGS accuracy decreases across bins of GD. The x-axis is the average GD for all individuals within each GIA cluster or GD bin; the y-axis is the accuracy for each GIA cluster or GD bin. The dot and error bar show mean and 1.96 standard error of the mean across 84 traits.

