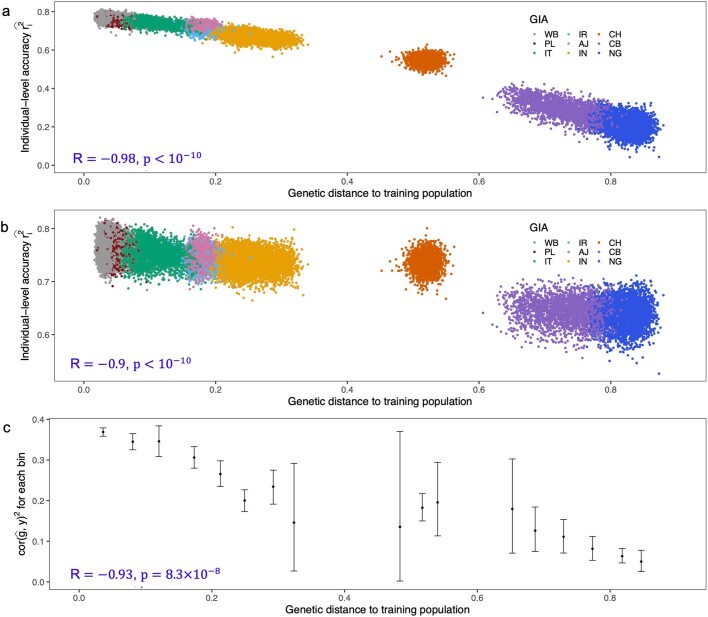
Extended Data Fig. 10. Comparison of individual accuracy for height in UKBB.
(a) Accuracy computed from equation (1), with set as fixed heritability; (b) Accuracy computed from equation (1), with estimated from Monte Carlo sampling from prior distribution of . (c) Empirical accuracy estimated as the squared correlation between PGS and height for each genetic distance bin. All UKBB individuals are divided into 20 equal-interval GD bins. The x-axis is the average GD within the bin; the y-axis is the squared correlation between PGS and phenotype for individuals in the bin. The dot and error bar show mean and 95% confidence interval from 1000 bootstrap samples. Both (a) and (b) reflect the decreasing trend of empirical accuracy in (c). All p-values were derived from two-sided Pearson correlation tests without adjustment for multiple hypothesis testing. Any p-value below is shown as .

