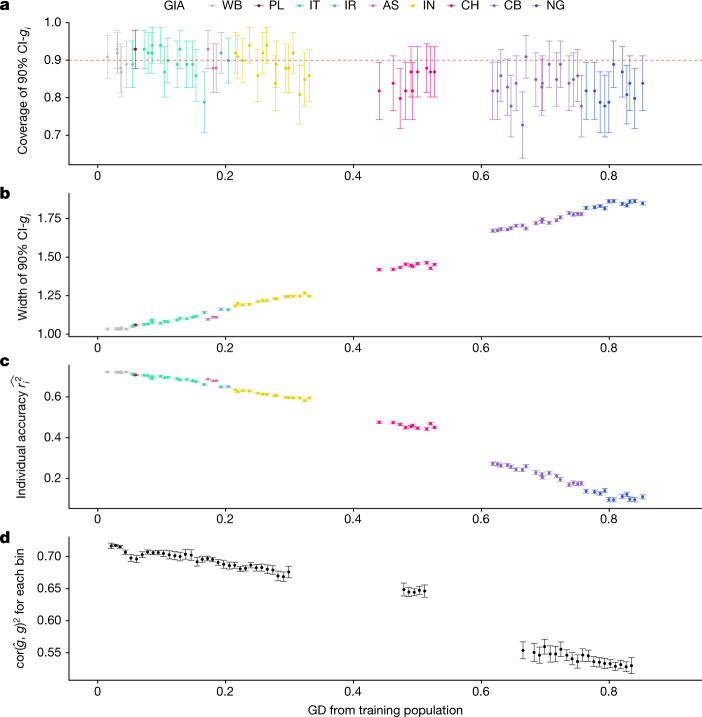
Fig. 2. PGS performance is calibrated across GD in simulations using UKBB data.
a, The 90% credible intervals of genetic liability (CI-gi) are well calibrated for testing individuals at all GDs. The red dashed line represents the expected coverage of the 90% CI-gi. Each dot represents a randomly selected UKBB testing individual. For each dot, the x-axis is its GD from the training data, the y-axis is the empirical coverage of the 90% CI-gi calculated as the proportion of simulation replicates for which the 90% CI-gi contain the individual’s true genetic liability, and the error bars represent the mean ±1.96 standard error of the mean (s.e.m.) of the empirical coverage calculated from 100 simulations. b, The width of the 90% CI-gi increases with GD. For each dot, the y-axis is the average width of the 90% CI-gi across 100 simulation replicates, and the error bars represent ±1.96 s.e.m. c, Individual PGS accuracy decreases with GD. For each dot, the y-axis is the average individual-level PGS accuracy across 100 simulation replicates, and the error bars represent ±1.96 s.e.m. d, Population-level metrics of PGS accuracy recapitulates the decay in PGS accuracy across the genetic continuum. All UKBB testing individuals are divided into 100 equal-interval bins based on their GD. The x-axis is the average GD for the bin, and the y-axis is the squared correlation between genetic liability and PGS estimates for the individuals within the bin. The dot and error bars represent the mean and ±1.96 s.e.m from 100 simulations, respectively.

