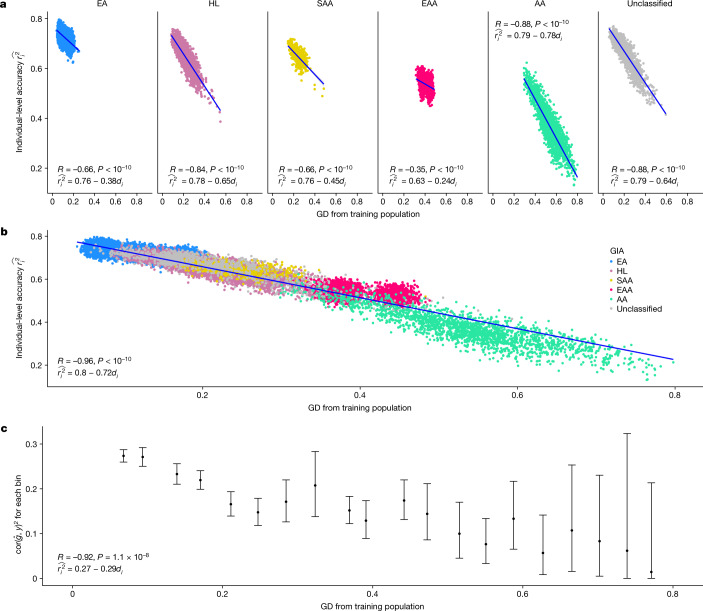
Fig. 3. The individual-level accuracy for height PGS decreases across the genetic ancestry continuum in ATLAS.
a, Individual PGS accuracy decreases within both homogeneous and admixed genetic GIA clusters. Each dot represents a testing individual from ATLAS. For each dot, the x-axis represents its distance from the training population on the genetic continuum; the y-axis represents its PGS accuracy. The colour represents the GIA cluster. b, Individual PGS accuracy decreases across the entire ATLAS. c, Population-level PGS accuracy decreases with the average GD in each GD bin. All ATLAS individuals are divided into 20 equal-interval GD bins. The x axis is the average GD within the bin, and the y axis is the squared correlation between PGS and phenotype for individuals in the bin; the dot and error bar show the mean and 95% confidence interval from 1,000 bootstrap samples. R and P refer to the correlation between GD and PGS accuracy and its significance, respectively, from two-sided Pearson correlation tests without adjustment for multiple hypothesis testing. Any P value below 10−10 is shown as . EA, European American; HL, Hispanic Latino American; SAA, South Asian American; EAA, East Asian American; AA, African American.

