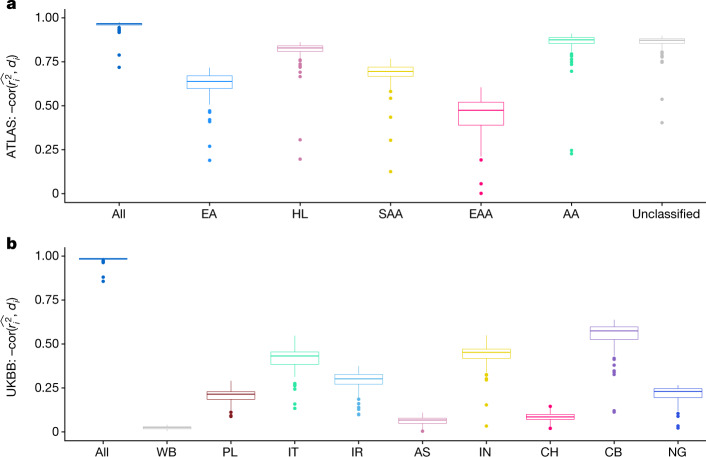
Fig. 4. The correlation between individual PGS accuracy and GD is pervasive across 84 traits across ATLAS and the UKBB.
a, The distribution of correlation between individual PGS accuracy and GD for 84 traits in ATLAS. b, The distribution of correlation between individual PGS accuracy and GD for 84 traits in the UKBB. Each box plot contains 84 points corresponding to the correlation between PGS accuracy and GD within the GIA group specified by the x-axis for each of the 84 traits. The box shows the first, second and third quartiles of the 84 correlations, and the whiskers extend to the minimum and maximum estimates located within 1.5 × IQR from the first and third quartiles, respectively. Numerical results are reported in Supplementary Tables 2 and 3.

