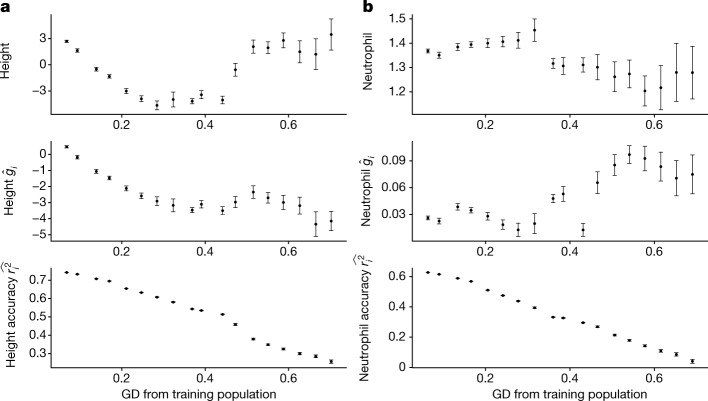
Fig. 5. Measured phenotype, PGS estimates and accuracy vary across ATLAS.
a, Variation of height phenotype, PGS estimates and accuracy across different GD bins in ATLAS. b, Variation of log neutrophil count phenotype, PGS estimates and accuracy across different GD bins in ATLAS. The 36,778 ATLAS individuals are divided into 20 equal-interval GD bins. Bins with fewer than 50 individuals are not shown owing to large s.e.m. All panels share the same layout: the x axis is the average GD within the bin; the y axis is the average phenotype (top), PGS (middle) and individual PGS accuracy (bottom); the error bars represent ±1.96 s.e.m.

