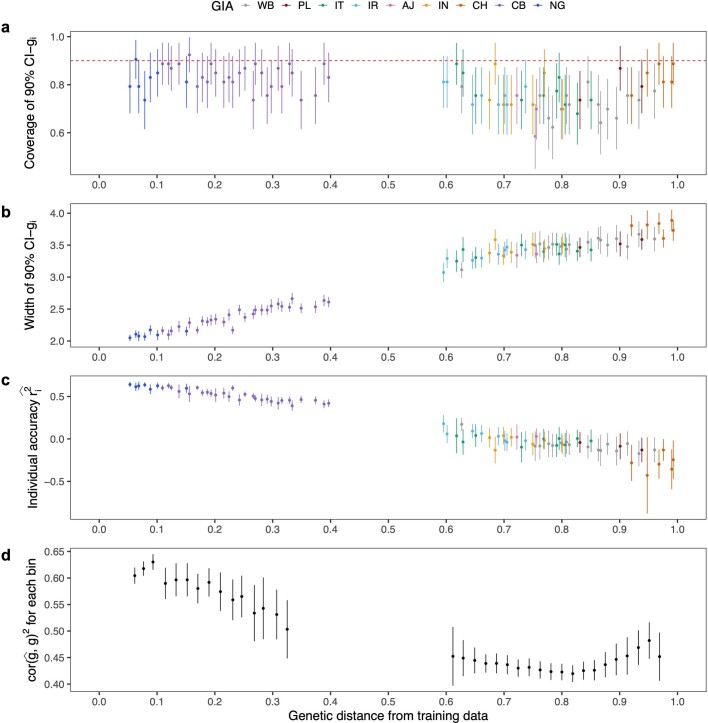
Extended Data Fig. 3. PGS performance varies across GD in simulations using CB and NG as training data ( and ).
(a) The coverage of the 90% credible intervals of genetic liability (CI-gi) is approximately uniform across testing individuals at all GDs. (b) The width of 90% CI-gi increases with GD. (c) Individual PGS accuracy decreases with GD. (d) Population-level metrics of PGS accuracy recapitulates the decay in PGS accuracy across genetic continuum. See Extended Data Fig. 2 for a detailed figure description.

