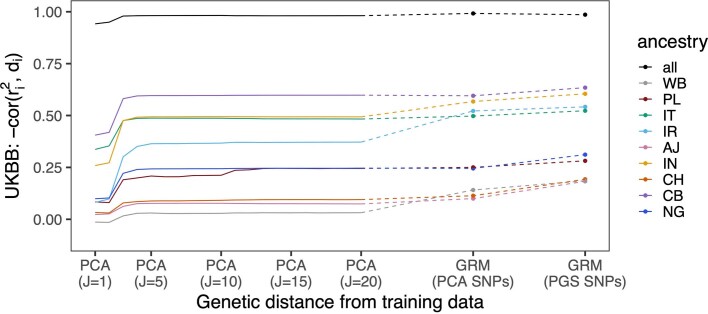
Extended Data Fig. 4. The effect of different metrics of GD on the correlation between GD and accuracy.
The y-axis is the correlation between the GD and PGS accuracy; a larger correlation means GD has a better prediction of accuracy. The x-axis are different GD metrics: (1) GD based on PCA with varying number of PCs (from J = 1 to J = 20) and (2) GD based on GRM using pruned PCA SNPs only or all SNPs in PGS models. The GRM GD is computed as , where is the standardized genotype of testing individual and is the standardized genotype of training individual.

