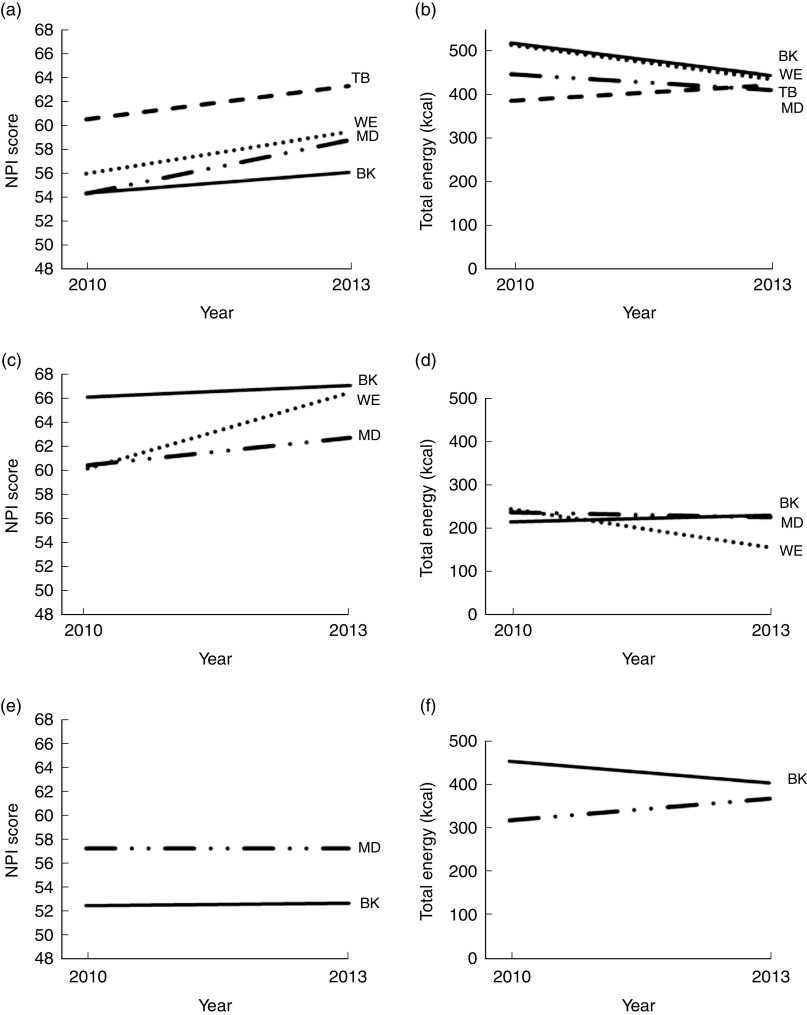
Fig. 1.
Change in mean Nutrient Profile Index (NPI) scores (a, c, e) and energy (b, d, f) from 2010 to 2013 in all menu items marketed on general menu boards (a, b), the kids’ section of menu boards (c, d) and signs (e, f) in four major (US) fast-food restaurant chains (100 locations per chain:  , McDonald’s (MD);
  , Burger King (BK);
  , Wendy’s (WE);
  , Taco Bell (TB)). NPI is an overall nutritional quality score based on energy, sodium, saturated fat, sugar, protein and fibre(
26
); scores range from 0 (poorest nutritional quality) to 100 (highest nutritional quality). Values plotted represent unadjusted mean NPI scores and energy (to convert to kJ, multiply kcal values by 4·184), but restaurant abbreviations in plots denote chains where mean differences across time were significant (at P<0·05) in adjusted analyses. Taco Bell was not included in the kids’ menu board analysis (c, d) because it discontinued its kids’ menu in 2013 before data collection. Wendy’s and Taco Bell were not included in the sign analysis (e, f) due to missing data.

