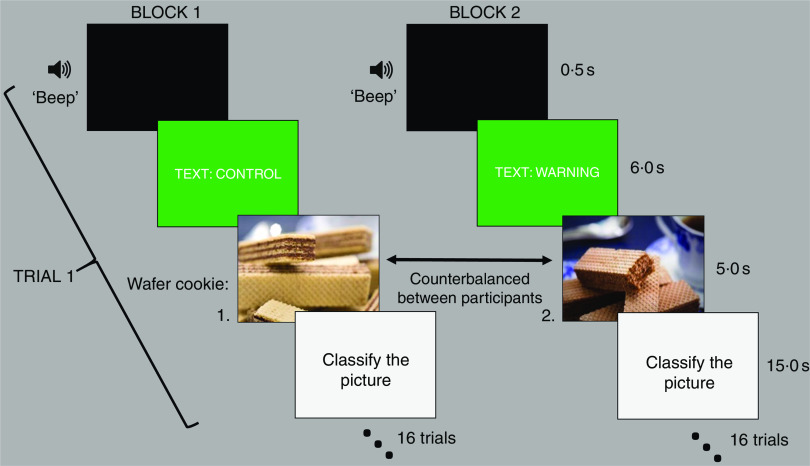
Fig. 4.
(colour online) Schematic representation of the sequence of events in a trial. The experimental session was divided into two blocks. During each session sixteen pictures of ultra-processed products were preceded by control texts (block 1), and the other sixteen pictures from the same products were preceded by warning texts (block 2). The pictures presented for each condition (control or warning) were counterbalanced between the participants. Then, for each picture (the wafer cookie 1, for example), the mean ratings for the warning condition were obtained from one group of participants, and the ratings for the control condition were obtained from the other group of participants

