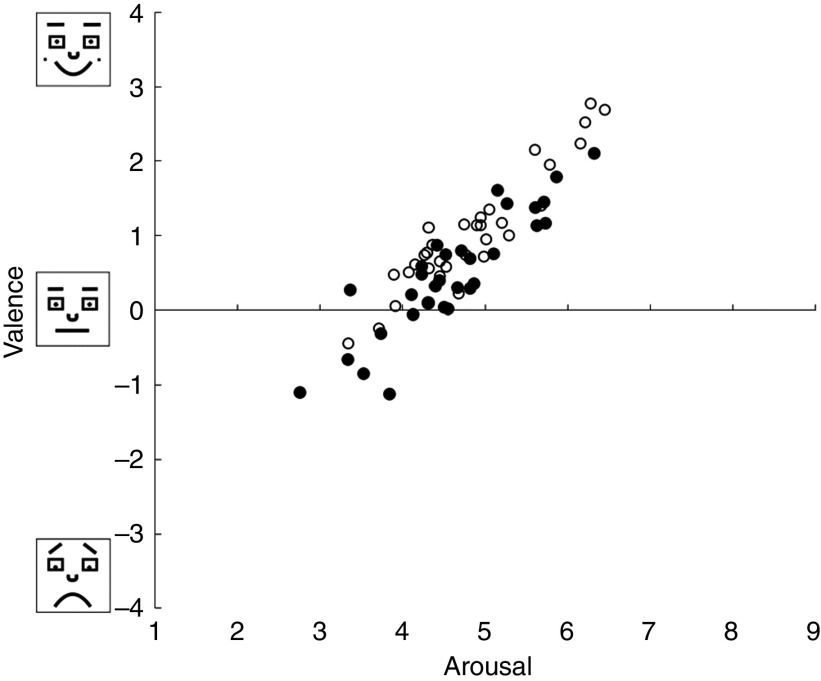
Fig. 5.
Distribution of the pictures’ ratings during the warning and control conditions on a bidimensional affective space. Valence is depicted on the y-axis and arousal on the x-axis. Each point in the graph represents a picture. The pictures preceded by text warnings are shown as (●) and the same pictures preceded by control texts are shown as (○)

