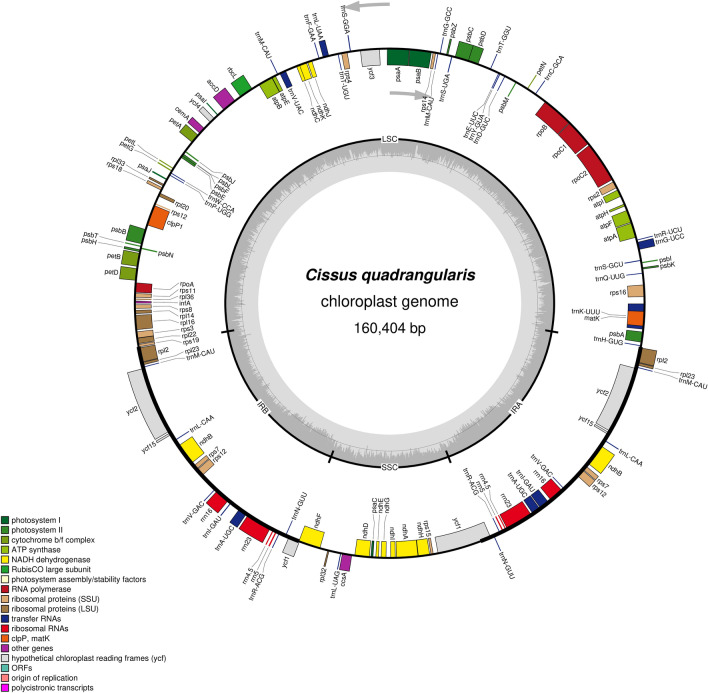
Fig. 1.
Circular map of C. quadrangularis whole chloroplast genome along with gene annotations. Genes shown outside the outer circle are transcribed anti-clockwise, and those inside the circle are transcribed clockwise. Genes belonging to different functional groups are colour coded. The grey colour inside the circle indicates the GC content and the lighter grey depicts the AT content

