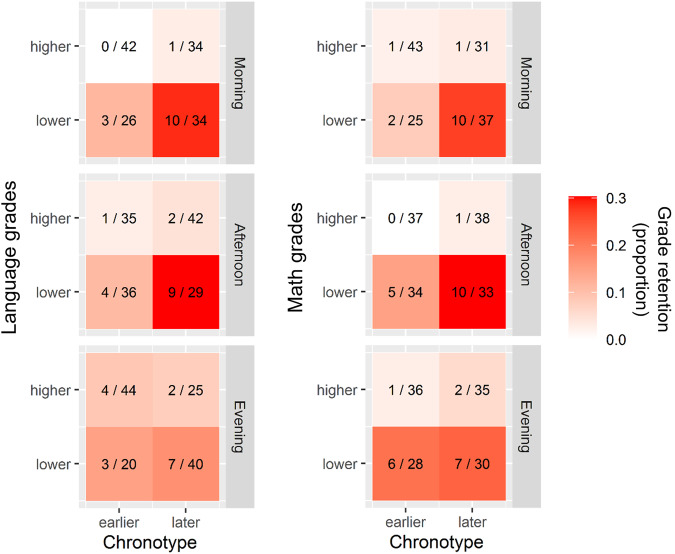
Fig. 2. Grade retention depends on academic performance, chronotype, and its interaction with school timing.
The proportion of repeating students in different school timings varies between quadrants defined by chronotype (i.e. MSFsc) and grades medians. We calculated the mean grade for either Math and Language for each student, and then we divided those values in two groups in each school timing: the ones who are above the median (higher or equal) and the ones below it (lower). We also obtained two groups in each school timing for individuals’ chronotype: the one with MSFsc values above (later) and the ones with values below (earlier) the MSFsc median. Then, for each school timing and school subject, four quadrants were defined by the intersection of chronotype and grades (either language or math) medians. Then, for each school timing, four quadrants were defined by the intersection of chronotype and language and math grades medians. The number on the right on each quadrant represents the total number of 1st year students that belong to this quadrant and the number on the left represents the quantity of those students that did not timely reach 5th year (i.e. who were not at school four years later). Color represents the ratio between both numbers, which is the proportion of students that did not reach timely 5th year (a darker red indicates a higher proportion of students who repeat a grade). Note that this figure is useful to illustrate the results, but MSFsc and math and language grades were included as numerical variables in the model, even though here we represent them as factors. n = 407.

