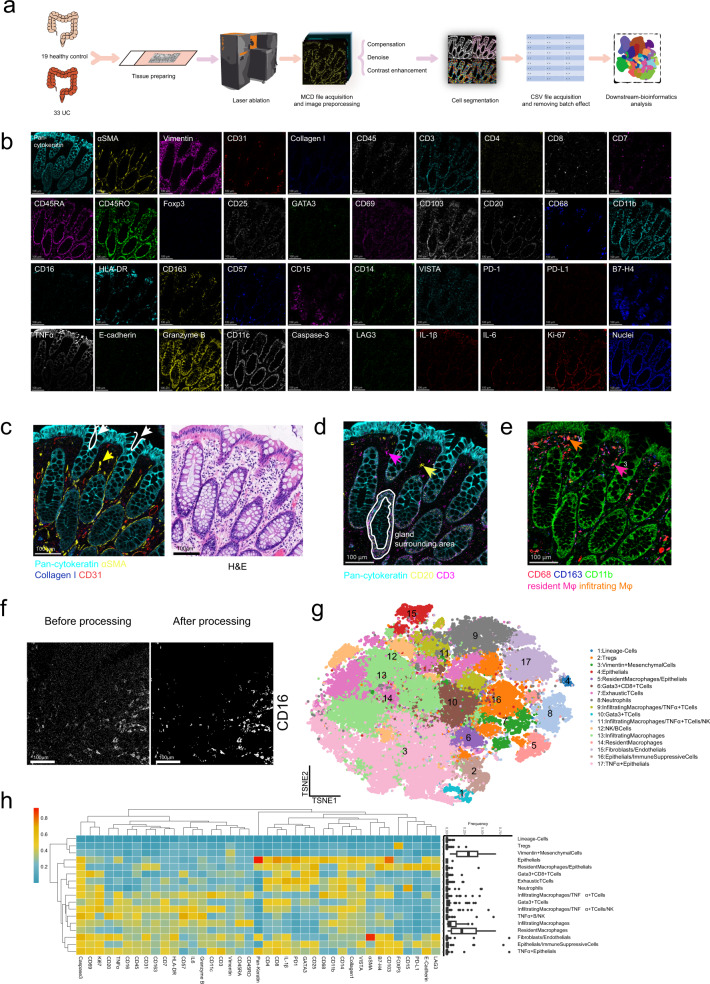
Fig. 1. Imaging mass cytometry pipeline based on the 40-marker panel.
a The workflow of IMC. Patients’ UC and healthy donors’ samples were acquired by IMC. IMC images went through preprocessing before cell segmentation, followed by batch effect removing and downstream bioinformatics analysis. b Single color staining of the indicated marker above each plot. Representative plot from 52 samples (2 independent experiments). c Pan-cytokeratin (cyan), αSMA (yellow), Collagen I (blue), and CD31 (red) were used to portray the structure of colonic tissue (left image). H&E staining (right image). Scale bars, 100 μm. The white arrows and curves point out intestinal glands. And the yellow arrows mark smooth muscles cells labeled with αSMA (yellow) in lamina propria. d Pan-cytokeratin (cyan), CD20 (yellow), and CD3 (magenta) highlight the distribution of T cells and B cells in colonic tissue. Arrow 1 (magenta) and arrow 2 (yellow) indicate the T cells and B cells, respectively. Scale bars 100 μm. e CD68 (red), CD163 (blue) and CD11b (green) distinguish resident macrophages and inflammatory macrophages. Due to the overlap of colors, we used arrow 3 (plum) to highlight the resident macrophages (CD68+CD163+CD11b−) and arrow 4 (orange) to point out the infiltrating macrophages (CD68+CD163−CD11b+). Scale bars 100 μm. f Raw IMC image and processed image of CD16 staining. Scale bars, 100 μm. Representative plot from 52 samples (2 independent experiments). g t-SNE plots were based on the single-cell data extracted from IMC images. 17 clusters of cells from normal and ulcerative colitis samples were defined according to their markers. h The heat map showing the max-min normalized mean marker expression of 17 clusters with their frequency distribution pattern across different patients shown in the box plot.

