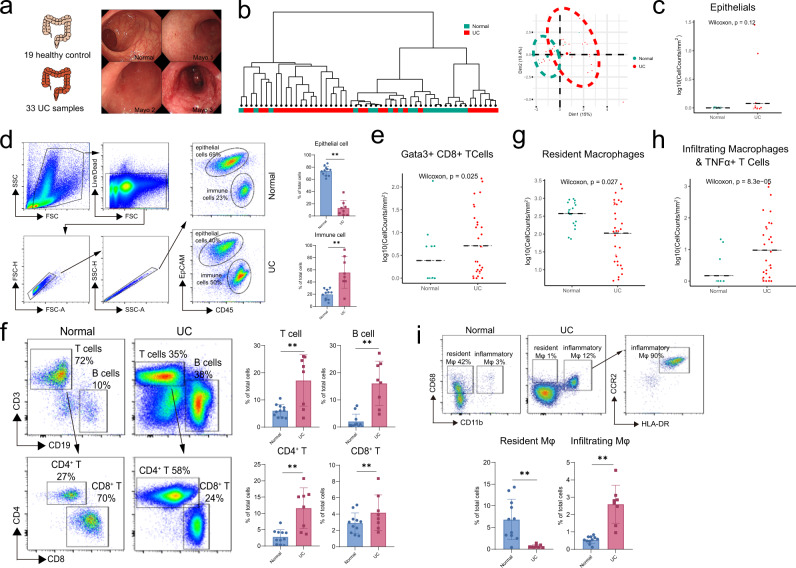
Fig. 2. Intestinal ecosystem changes revealed by IMC.
a 52 patient and donors’ samples were separated into 2 classes: normal (green) and UC (red), determined by Mayo Clinic Endoscopic Subscore. Patients’ clinical characteristics were also summarized. b Dendrogram based on cell type fractions showing the hierarchical relationship between samples and PCA plot showing similarities between cell type fractions of each sample from normal (green) and UC (red) groups. c, d The distribution of epithelial cells based on IMC results in c. (Normal, n = 19; UC, n = 33 from two independent experiments), statistical significance performed with two-sided Wilcoxon rank-sum tests and verification by FACS analysis of fresh samples, as shown in d. Statistic results (Normal, n = 11; UC, n = 8 from 8 independent experiments) were shown in the right panel of d as mean +/− SD and performed with a two-sided Wilcoxon rank-sum tests (***P < 0.001). Exact P values were provided in the Source Data file. e, f The distribution of T cells based on IMC results (Normal, n = 19; UC, n = 33 from two independent experiments), statistical significance performed with two-sided Wilcoxon rank-sum tests shown in e and verification by FACS analysis of fresh samples, as shown in f. Statistic results (Normal, n = 11; UC, n = 8 from 8 independent experiments) were shown in the right panel of f as mean +/− SD and performed with a two-sided Wilcoxon rank-sum tests (**p < 0.01). Exact P values were provided in the Source Data file. g, h The distribution of resident macrophages and infiltrating macrophages based on IMC results (Normal, n = 19; UC, n = 33 from 2 independent experiments). Statistical significance were performed with two-sided Wilcoxon rank-sum tests. Exact P values were provided in the Source Data file. i The distribution of the resident and infiltrating macrophages by FACS analysis of fresh samples. Statistic results (Normal, n = 11; UC, n = 8 from 8 independent experiments) were shown in the right panel of i as mean +/− SD and performed with a two-sided Wilcoxon rank-sum tests (**P < 0.01). Exact P values were provided in the Source Data file.

