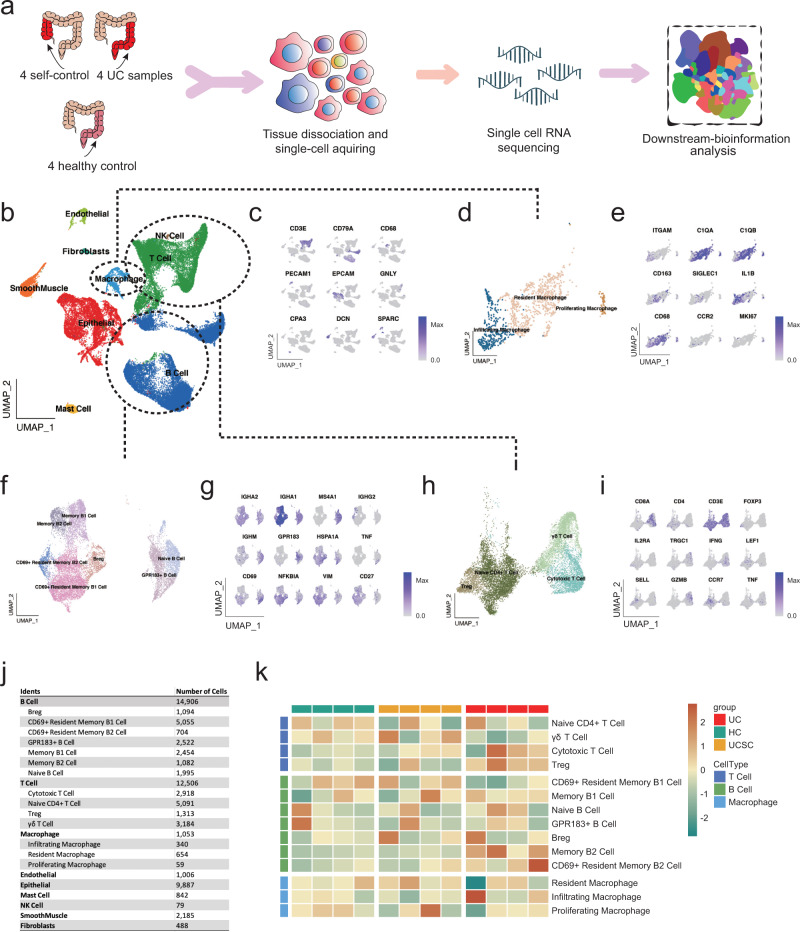
Fig. 4. A single-cell transcriptomic atlas of the microenvironment in UC.
a The brief schematic of the single-cell RNA-seq analysis pipeline. b UMAP plot showing nine major cell type clusters identified based on the scRNA-seq data. c UMAP plot displaying key makers of each major cell type. d, e UMAP plot displaying sub-clusters of macrophage populations and e Key markers of each macrophage sub-cluster. f, g UMAP plot displaying sub-clusters of B cell populations and g Key markers of each B cell sub-cluster. h, i UMAP plot displaying sub-clusters of T cell populations and i Key markers of each T cell sub-cluster. j Cell number statistics for major cell types and corresponding sub-clusters. k Heatmap showing the abundance of sub-clusters of macrophages, T, and B cells across samples. Subset frequency was normalized to total cells and row scaled by z-score.

