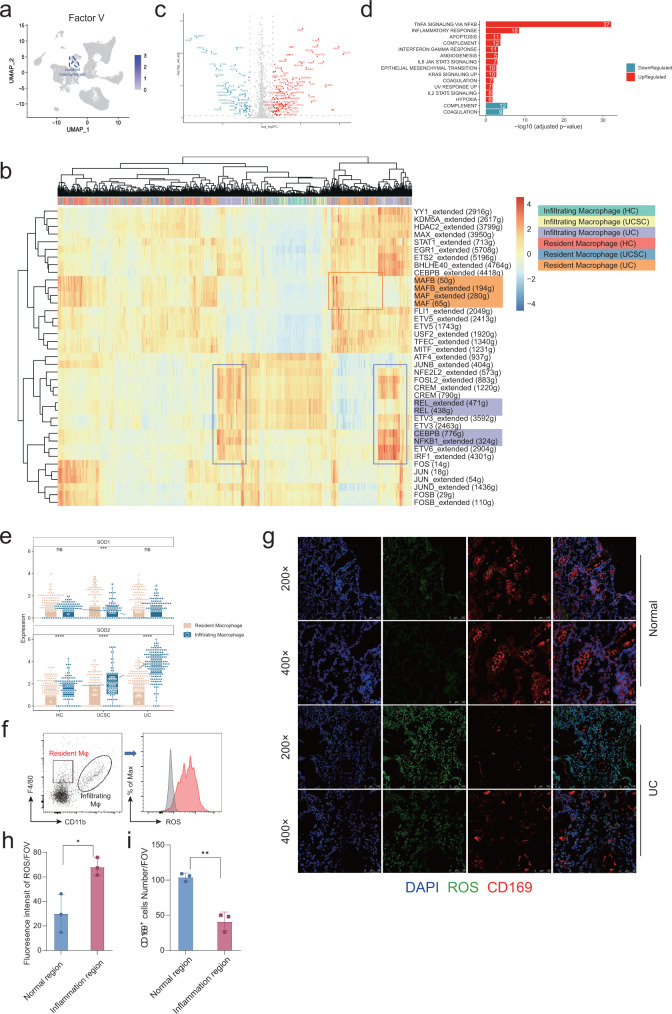
Fig. 5. The mechanism of resident macrophage disappearance reaction.
a UMAP identifying expression of Factor V within all major populations. b Heatmap of regulon activities analyzed by SCENIC for inflammatory and resident macrophages. The top row refers to cell types and sample origins. c Volcano plot showing genes differentially expressed between inflammatory and resident macrophages in UC patients (adjusted p-value < 0.05 and |log2 Fold Change| > 1.5). d Enrichment analysis on Hallmark gene sets based on the up-/downregulated genes compared inflammatory to resident macrophages in UC patients (adjusted p-value < 0.05). e Expressions of SOD1/2 for inflammatory and resident macrophages in HC (Resident Macrophag, n = 199; Infiltrating Macrophage, n = 96), UCSC (Resident Macrophag, n = 201; Infiltrating Macrophage, n = 76), and UC groups (Resident Macrophag, n = 254; Infiltrating Macrophage, n = 168). Each box represents the 25th to 75th percentile of values. Minima and maxima are present in the boxplot’s lower and upper bounds and whiskers represent 1.5 × IQR away from upper/lower quartile or maxima/minima, whichever is closer. Statistics were performed with two-sided Wilcoxon rank-sum tests (ns P > 0.05, *P < 0.05, **P < 0.01, ***P < 0.001, ****P < 0.0001). The scRNA-seq data were preprared from 8 experiments. Exact P values were provided in the Source Data file. f–i Representative plot for ROS reporter analyzed by FACS for infiltrating and resident macrophage shown in f and statistical results shown in h (n = 3 in both normal and inflammation region from one experiment). Representative image for ROS reporter together with immunofluorescence staining of CD169 (a marker for resident macrophage) were shown in g and statistical results (n = 3 in both normal and inflammation region from one experiment) for the absolute count of resident macrophage shown in i. Data were shown as mean +/− SD and performed with two-tailed T test (*P < 0.05, **P < 0.01). Exact P values were provided in the Source Data file.

