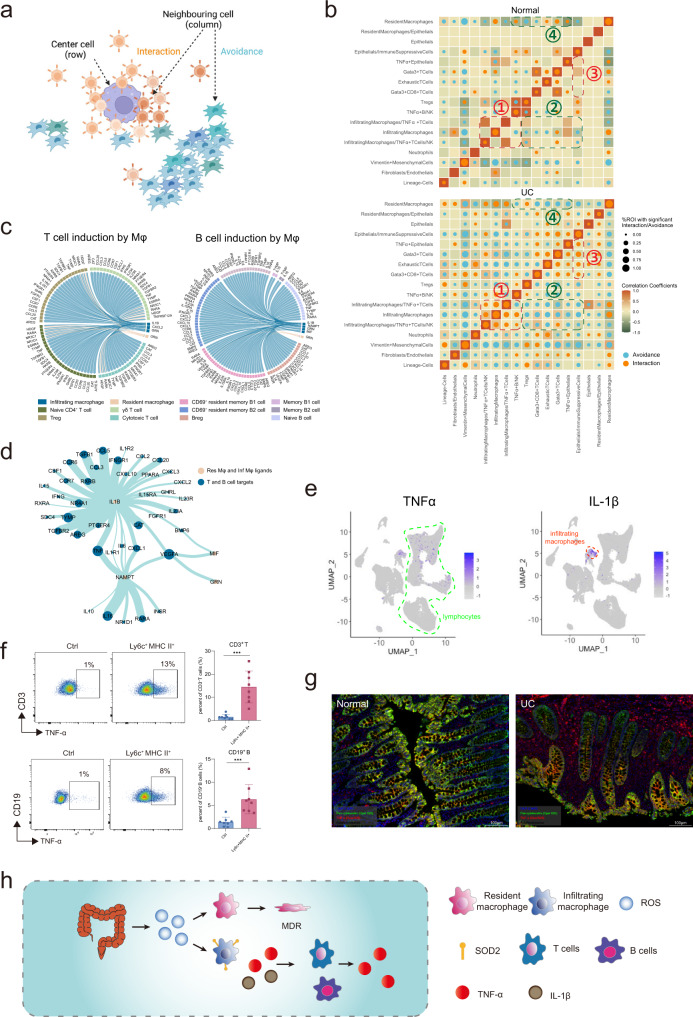
Fig. 7. Infiltrating macrophages induces a spatial shift of TNF-α production.
a Schematic of spatial cell-cell cross talk analysis. Cell-cell crosstalk was categorized into interaction and avoidance co-occurrence patterns. b Circles indicating patterns of cell-cell interactions/avoidance for normal and UC (Normal, n = 19; UC, n = 33 from two independent experiments). The circle size shows the percentage of ROIs with significant interaction/avoidance determined by the permutation test. Rows represent the cell type of interest (center cell) and columns represent other cell types surrounding the interest cell type (neighboring cell). Colors in the heatmap indicate the Pearson correlation between cell types across all ROIs in normal and UC respectively. c Circos plots showing cell-cell communications from inflammatory/resident macrophages to T/B cells involving chemokines and cytokines. d Network graph summarizing cell-cell communications between macrophages and T/B cells. Vertex sizes and edge widths scale to numbers of interacted cell types. e UMAP identifying distinguishable expression of TNF-α in lymphocytes and IL-1β in infiltrating macrophages, T cells, and B cells. f Ly6c+ MHC II+ inflammatory macrophages were sorted from the colon in DSS treated mice and cultured with lymphocytes from mesenteric lymph nodes. Representative plots and statistics results (ctrl, n = 8; Ly6c+ MHC II+, n = 8 from two independent experiments) were shown for TNF-α production from CD3+ T cells and CD19+ B cells after the co-cultivation as mean +/− SD and performed with two-tailed T test (***p < 0.001). Exact P values were provided in the Source Data file. g mIHC staining of TNF-α production. Intestinal tissues from normal and UC patients were stained with Pan-cytokeratin (green), TNF-α (red), and DAPI for DNA (blue). All markers were listed in the legend on the image. Scale bars, 100 μm. Representative plot from 5 samples (2 independent experiments). h The abstract diagram interprets the mechanism of the resident macrophage disappearance effect. ROS was elevated as the first defense against the invading bacteria. At the same time, immune-suppressive resident macrophage was wiped out purposely due to their sensitivity to ROS and replaced by inflammatory macrophage which was resistant to ROS based on the high level of SOD2. Furthermore, inflammatory macrophages played a key role in forming the inflammatory cellular network by producing TNF-α and IL-1β. Resident macrophages might go through cell death due to high ROS stress.

