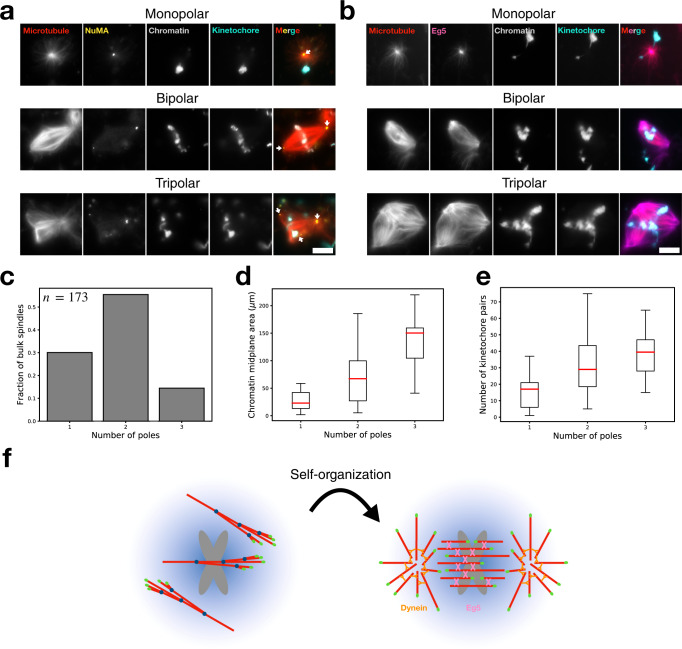
Fig. 6. Immunofluorescence and analysis of bulk spindle organization.
Epifluorescence visualization of fixed mono-, bi-, and tripolar spindles organized around purified chromosome clusters in bulk extract immunostained for a NuMA and b Eg5. Images shown are midplanes of a z-stack. White arrows mark the poles which show sharp NuMA localization. Scale bars are 10 μm. c Number of monopolar (n = 52), bipolar (n = 96), and tripolar (n = 25) spindles. n = 173 spindles total across 13 extract preparations. The number of spindle poles increases with d increasing chromatin area and e increasing chromosome number. Chromatin areas were measured at the spindle midplane. Chromosome numbers were manually determined by counting kinetochore pairs throughout each z-stack. The minimum number of chromosomes that formed a monopolar, bipolar, or tripolar spindle were 1, 5, and 15, respectively. Boxes are interquartile ranges, whiskers extend 1.5× the interquartile range, and red lines are medians. f Schematic of our general model for acentrosomal spindle assembly. First, de novo microtubules randomly enter the SAF gradient generated by chromosomes. Branching microtubule nucleation occurs along these first mother microtubules, generating branched networks. These branched networks are then self-organized by molecular motors such as dynein and Eg5 into a bipolar spindle.

