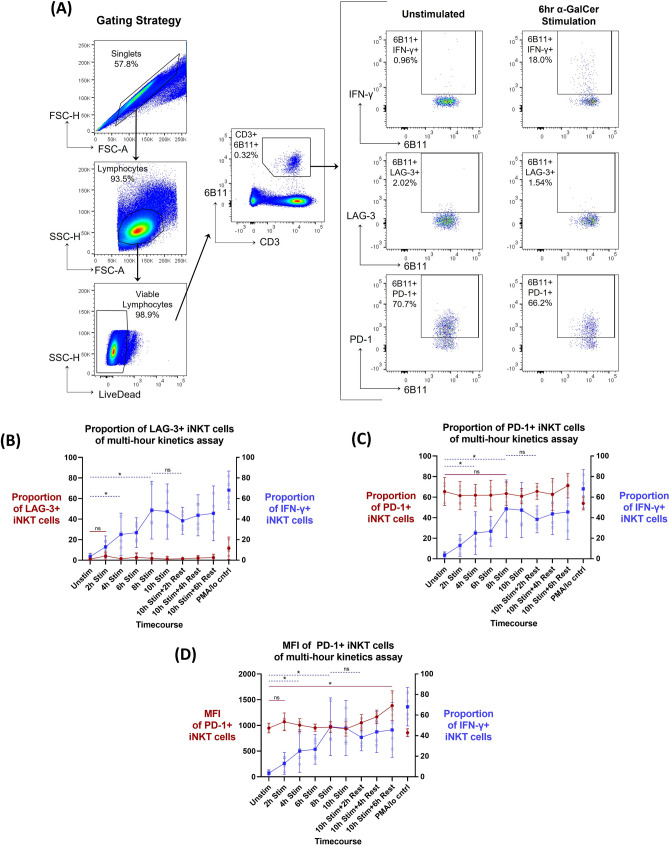
Figure 1.
Kinetics of PD-1 and LAG-3 surface expression following a multi-hour α-GalCer iNKT cell activation and rest assay (n = 4). (A) Example of iNKT flow cytometry gating strategy. (B) LAG-3 proportion of parent population expression (left y-axis, red line), (C) PD-1 proportion of parent population expression (left y-axis, red line) and (D) median fluorescent intensity (MFI) of PD-1 + iNKT cells (left y-axis, red line) in relation to proportion of parent population IFN-γ production (right y-axis, blue line) over the multi-hour α-GalCer stimulation time course. Mean and 95% confidence intervals are represented at each timepoint for both datasets, with the mean represented as either circles (left y-axis) or squares (right y-axis). Raw data values are represented as smaller open dots. Paired two-tailed T-tests have been selected to highlight specific dataset trends (dashed blue line: right y-axis dataset; straight red line: left y-axis dataset), where p < 0.05 were considered significant (*< 0.05, **< 0.01, ***< 0.001, ns: not significant).

