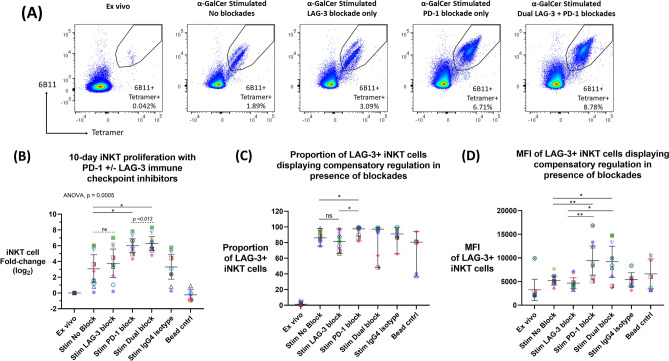
Figure 3.
Anti-PD-1 and anti-LAG-3 single or dual blockade application during a 10-day α-GalCer iNKT cell proliferation assay (n = 9). (A) Example of one donor’s iNKT cell proliferation by flow cytometry data with or without PD-1 + /− LAG-3 blockade application. (B) Fold change (log2) of iNKT cell population following 10-day α-GalCer stimulation assay with or without PD-1 + /− LAG-3 blockade, compared to no blockade or isotype control. ANOVA and Dunnett’s multiple comparisons test were used to compare the mean of the LAG-3, PD-1 and Dual blockade conditions to the mean of the stimulation control “Stim no blockade” (solid line) where p < 0.05 were considered significant (* < 0.05, ** < 0.01, *** < 0.001). Mean (horizontal line) and 95% confidence intervals are represented in each condition. Paired two-tailed T-tests were used as a follow up comparison analysis (dash line), where p < 0.05 were considered significant (# < 0.05, ## < 0.01, ### < 0.001, ns: not significant). (C) Proportion and (D) MFI of LAG-3 + iNKT cell population following 10-day stimulation assay with or without PD-1 + /− LAG-3 blockade, where Wilcoxon two-tailed matched-pair signed-rank test and paired two-tailed T-test were used, respectively. p < 0.05 were considered significant (* < 0.05, ** < 0.01, *** < 0.001, ns: not significant). Colours and symbols represent individual donors.

