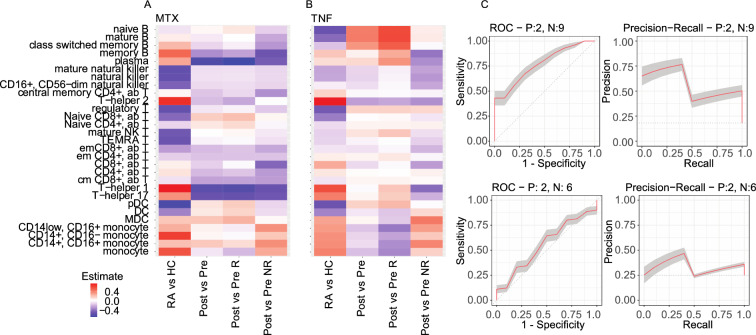
Figure 4.
Changes in cell proportions associated with treatment. The heatmap shows the proportion of cell types that change in RA compared to healthy controls (HC). (A,B) Additionally, the proportions were calculated before and after treatment with MTX and TNFi and for the responder (R) and non-responder populations (NR). The directionality of change (up/down) is represented by a color code (blue = down, red = up, white = no change). (C) Receiver operator curves and precision recall curves from predictions algorithms that use cell proportion to predict MTX responders (upper panels) and TNFi responders (lower panel).

