
Figure 5.
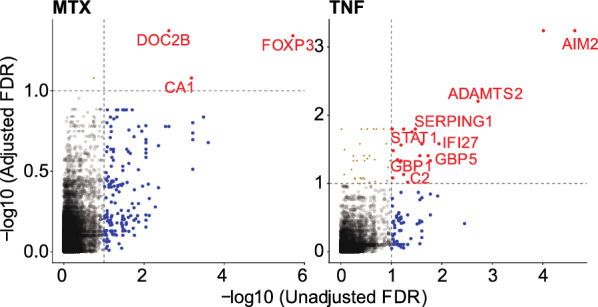
Gene expression changes associated with cell proportions. Scatterplots show the change in -log10 FDR values before and after adjustment for cell type proportions for MTX treatment over baseline (A) and TNFi treatment over baseline (B). The x-axis represents the FDR values adjusted for a technical variable (% percent duplicates) while the y-axis is adjusted for cell proportions for three main cell types (Monocytes, CD4+ T cells, and Plasma cells) and adjusted for prednisolone signature gene sets. The points are colored red if they are significantly regulated both pre- and post-adjustment, blue if they are regulated before cell proportion adjustment and green if they are regulated only after cell type adjustment.