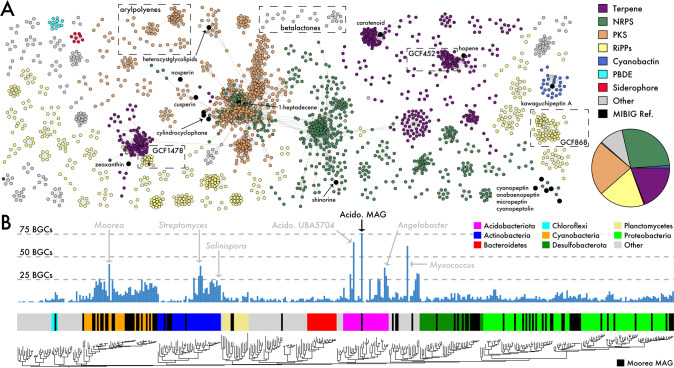
Fig. 2. Biosynthetic potential across marine sediment communities.
A Similarity network of identified biosynthetic gene clusters (BGCs) clustered into gene cluster families (GCFs), colored by BGC classification. Inset pie chart depicts relative proportion of BGC classes. Black nodes indicate known reference BGCs from the MIBIG database. Singleton and doubleton GCFs not shown. B BGC distributions across the bacterial phylogeny colored by phyla. Moorea MAGs denoted in black. A subset of reference genomes/MAGs indicated in light gray.

