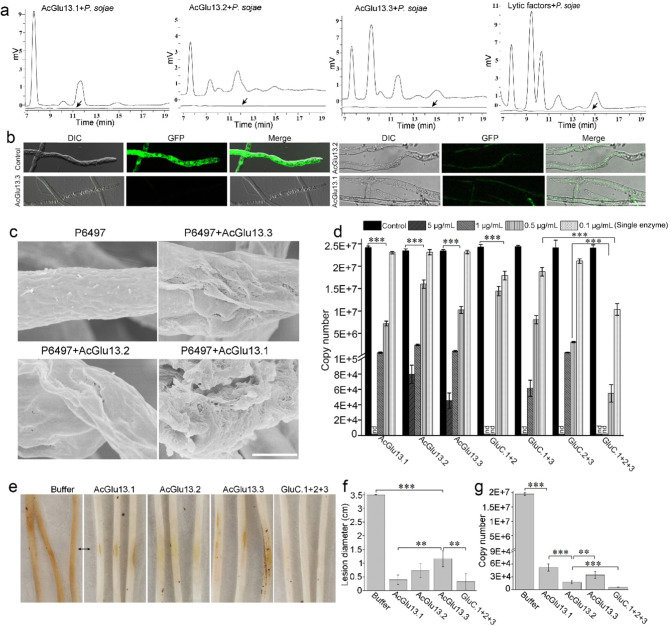
Fig. 5. AcGlu13.1, -13.2 and -13.3 degrade cell walls of P. sojae and reduce virulence.
a HPLC analysis of the released oligosaccharide from enzymatic hydrolysis of P. sojae cell wall material (200 mg/mL). The heat-inactive enzyme from the linear efflux curve was used as control (bottom flat lines, black arrow). b Microscopic analysis of enzyme treated GFP-labeled P. sojae mycelia. The reaction systems were done with purified AcGlu13.1, –13.2 and –13.3 (0.01 mg/mL) and P. sojae mycelia expressing cytoplasmic GFP, at 30 °C for 30 min. Cell envelop disruption was detect by loss of the GFP signal and the mycelial morphology was observed by DIC microscopy, scale bar: 25 μm. c SEM analysis of the cell walls of P. sojae P6497 after AcGlu13.1, –13.2 and –13.3 treatments (10 μg/mL). Scale bar, 2 μm. d Quantification of P. sojae biomass after AcGlu13.1, –13.2 and –13.3 treatments by qPCR in 96-well plates. The growth state of P. sojae was observed by light-microscope (Fig. S18a). The concentration of AcGlu13.1, –13.2 and –13.3 was 5, 1, 0.5 and 0.1 µg/mL, GluC.1 + 2: combinations of AcGlu13.1 and AcGlu13.2 (equal mass mixing); GluC.1 + 3: combines AcGlu13.1 and AcGlu13.3 (equal mass mixing); GluC.2 + 3: combines AcGlu13.2 and AcGlu13.3 (equal mass mixing); GluC.1 + 2 + 3: combines AcGlu13.1, -13.2 and -13.3 (equal mass mixing); nd, not detected. e–g Effects of enzymatic treatments on soybean hypocotyl infection. The agar discs (4-mm-diameter) of P6497 was pretreated by single enzyme (0.01 mg/mL) and GluC.1 + 2 + 3 (0.03 mg/mL) at 30 °C for 20 min before incubation. Representative photographs (e), average lesion diameters (f) and quantitative biomass of P6497 (g) with standard errors were analyzed. A value of p < 0.05 was considered statistically significant (**), value of p < 0.01 was considered statistically highest significant (***).

