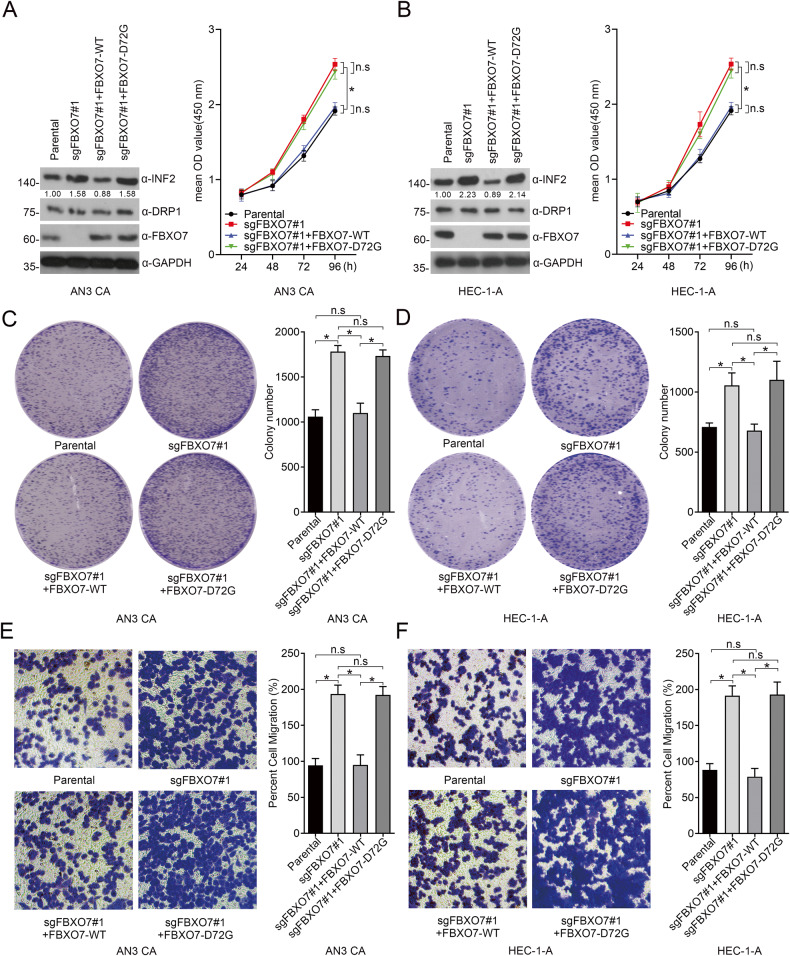
Fig. 5. FBXO7 knockout and FBXO7-D72G promote the proliferation and migration of ECa cells.
A Western blotting of WCLs of AN3 CA cells with FBXO7 knockout and transfected with pCDH-CD513B-FBXO7-WT/D72G plasmids, or parental. All quantitation were normalized to the protein level of endogenous parental GAPDH (Left). Cell proliferation assay of AN3 CA cells with FBXO7 knockout and transfected with pCDH-CD513B-FBXO7-WT/D72G plasmids, or parental (Right). Data are shown as means ± SD (n = 5). *p < 0.05. B Western blotting of WCLs of HEC-1-A cells with FBXO7 knockout and transfected with pCDH-CD513B-FBXO7-WT/D72G plasmids, or parental (Left). All quantitation were normalized to the protein level of endogenous parental GAPDH. Cell proliferation assay of AN3 CA cells with FBXO7 knockout and transfected with FBXO7-WT/D72G, or parental (Right). Data are shown as means ± SD (n = 5). *p < 0.05. C Cell colony formation assay of AN3 CA cells with FBXO7 knockout and transfected with pCDH-CD513B-FBXO7-WT/D72G plasmids, or parental (Left). Statistics of cell colony formation assay (Right). Data are shown as means ± SD (n = 3). *p < 0.05. D Cell colony formation assay of HEC-1-A cells with FBXO7 knockout and transfected with pCDH-CD513B-FBXO7-WT/D72G plasmids, or parental (Left). Statistics of cell colony formation assay (Right). Data are shown as means ± SD (n = 3). *p < 0.05. E Cell migration assay of AN3 CA cells with FBXO7 knockout and transfected with pCDH-CD513B-FBXO7-WT/D72G plasmids, or parental (Left). Statistics of cell migration assay (Right). Data are shown as means ± SD (n = 3). *p < 0.05. F Cell migration assay of HEC-1-A cells with FBXO7 knockout and transfected with pCDH-CD513B-FBXO7-WT/D72G plasmids, or parental (Left). Statistics of cell migration assay (Right). Data are shown as means ± SD (n = 3). *p < 0.05. Experiments in (A, B) were repeated three times.

