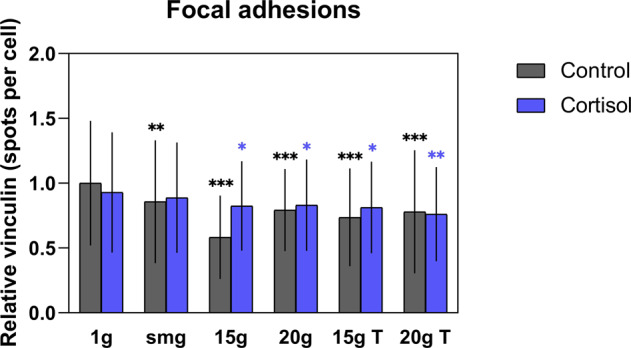
Fig. 3. Effect of altered gravity levels and cortisol exposure on the number of vinculin spots per cell.

The most evident reduction was found in fibroblasts exposed to 15 × g hypergravity and control vehicle. For each group, at least 100 cells were analyzed (with exception of the control vehicle –20 × g T group where 84 cells in total were analyzed). smg = simulated microgravity. 15 × g T and 20 × g T are hypergravity transition groups. Error bars show standard deviations. *P < 0.05, **P < 0.001, ***P < 0.0001. Statistical tests included ANOVA followed by post hoc analysis (see "Statistical analyses”). Asterisks show significance level compared to 1 × g control or cortisol exposed cells. Measures are divided by mean value of 1 × g controls to obtain relative values.
