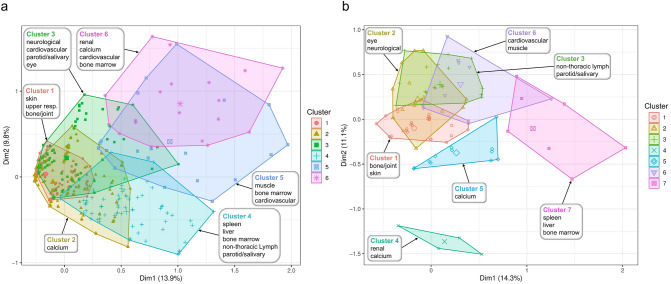
Fig. 2.
Clustering of systemic sarcoidosis phenotypes in African Americans and European Americans. Each point represents a sarcoidosis-affected individual’s contribution to the first two principal dimensions (Dim1 and Dim2), calculated with Multiple Correspondence Analysis (MCA) on organ involvement data. Enriched (or over-represented) affected organs are used for annotating each cluster. Panel a shows the clustering of organ involvement in African-Americans and Panel b shows the clustering of organ involvement in European-Americans

