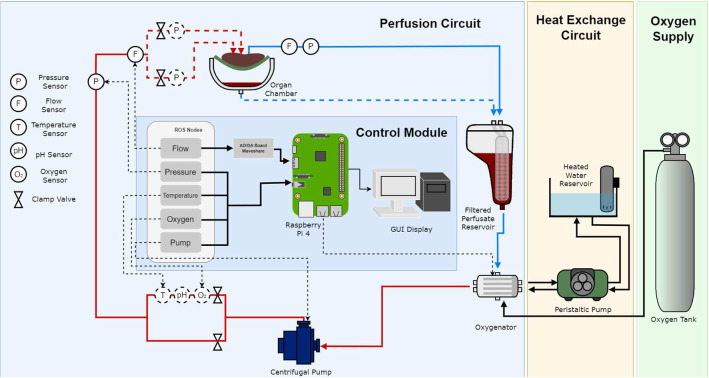
Fig. 2.
Schematic overview of the proposed perfusion system. The flow perfusion system circuit diagram is indicated by the red and blue lines corresponding to oxygenated and deoxygenated blood, respectively. Various sensors are placed on the input stream into the organ as well as a single pressure and flow sensor on the output stream leading back to the reservoir. The Raspberry Pi acts as the control module for all sensing on the system controlled by ROS2 topics. A GUI is also available for direct control and monitoring of all sensors. The dotted circles indicate sensors added at a later developmental stage of the design

