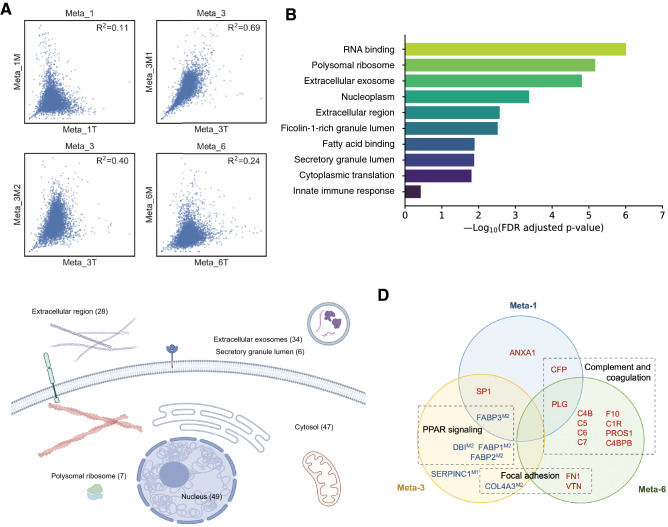
Fig. 2.
Proteomic features of paired primary GC and PM. A Scatterplot showing correlation of protein abundance in paired primary GC/PM samples, B Top ranked pathways that are significantly enriched in PM as compared with primary GC, C Subcellular distribution of proteins enriched in PM annotated with Gene Ontology, D Venn diagram presenting altered proteins (up- or downregulated in both primary and PM samples) in each subject and relevant pathways (for Meta-3M, proteins altered in superscript samples)

