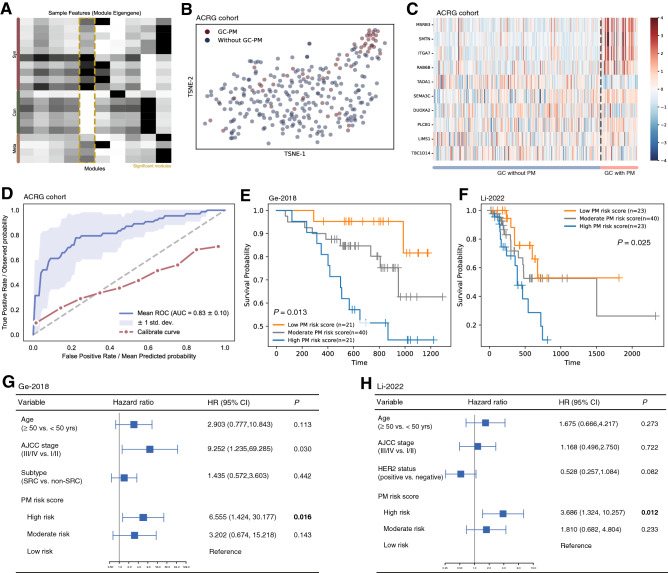
Fig. 4.
Establishment of PM-associated proteomic signature and external validation. A MATTE clustering of PM-associated module, B Heatmap depicting expression of ten proteins in GC with or without PM in ACRG cohort, C Dimension reduction of expression data in ACRG cohort; each dot represents one sample, D ROC curve of prediction model using Xgboost classifier, E–F Kaplan–Meier plot of Ge-2018 (E) and Li-2022 (F) cohort, G–H Forrest plot of multivariate Cox regression of Ge-2018 (G) and Li-2022 (H) cohort

