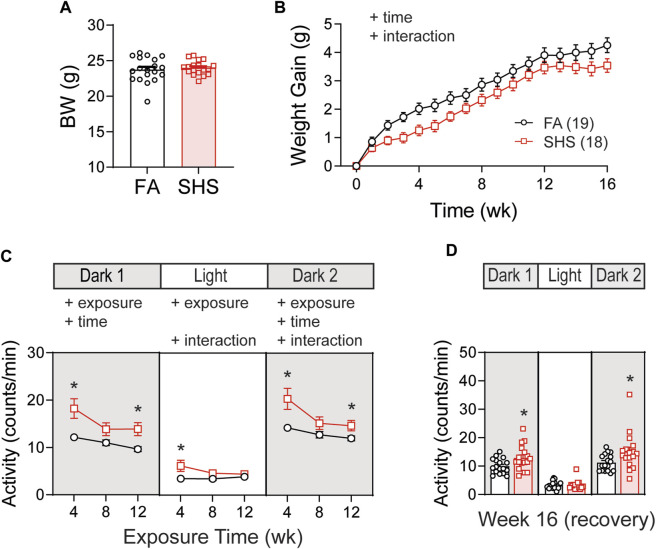
FIGURE 1.
Body weight (BW) and activity over the 16 weeks of study. (A). BW before exposure (week 0). There was no difference between filter air (FA)- and secondhand smoke (SHS)-exposed mice (t-test, p > 0.05). (B). Weight gain over the 16 weeks. The SHS group had significantly less weight gain (two-way repeated ANOVA). (C). Activity levels after 4, 8, and 12 weeks of exposure. SHS-exposed mice had higher activity levels (two-way repeated ANOVA followed by Fisher’s LSD tests). (D). Activity levels after 4 weeks of cessation from SHS. The SHS-exposed mice still had higher activity level during dark cycles (t-test). Significant main effects from ANOVA tests are indicated with “+”. *p < 0.05, FA vs. SHS. Numbers in parentheses indicate sample sizes.

