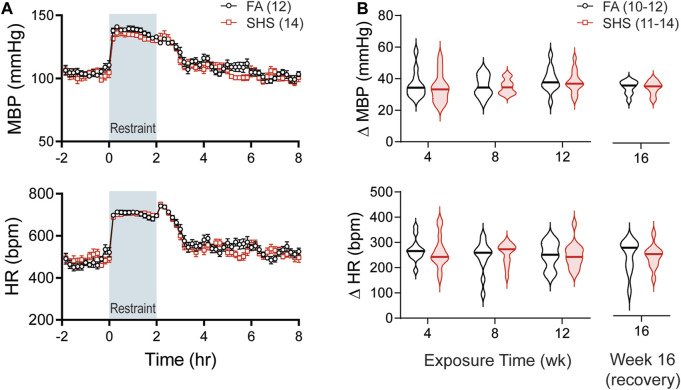
FIGURE 5.
BP and HR responses to restraint stress. (A). Group data of MBP and HR before, during, and after a 2-h restraint stress in mice after 12 weeks of FA or SHS exposure. (B). Group data of peak pressor and tachycardic response to restraint stress over the 16 weeks of experiment. There was no exposure effect (two-way repeated ANOVA for weeks 4–12, t-test for week 16). Numbers in parentheses indicate sample sizes.

