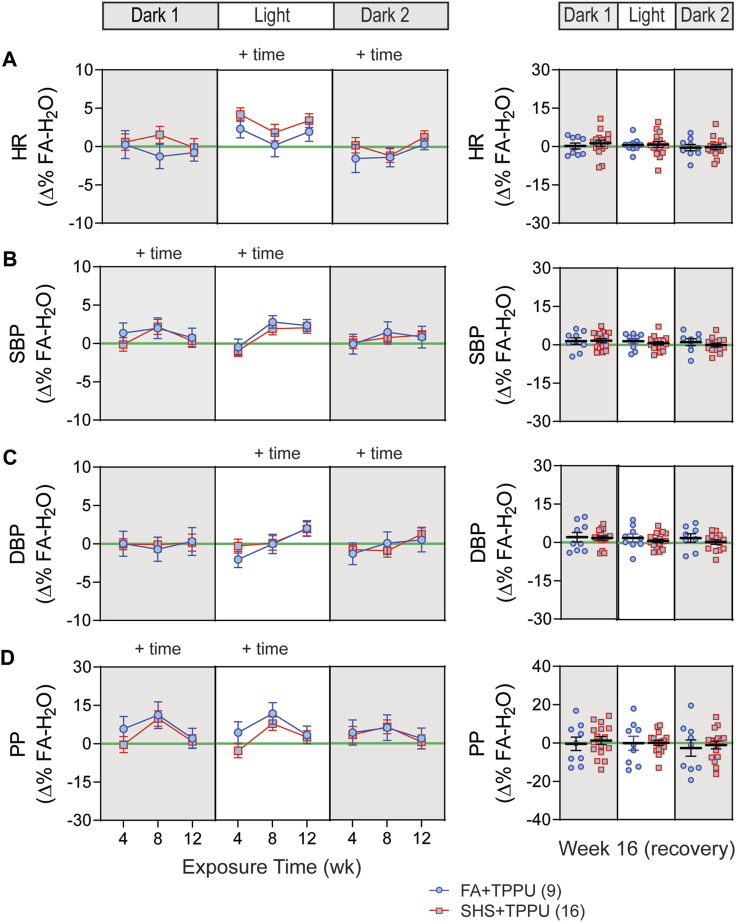
FIGURE 7.
BP and HR in sEH inhibitor treatment experiment. Data were expressed as Δ% of the mean values from the FA- H2O group. With TPPU treatment, there was no SHS exposure effect on HR (A), SBP (B), DBP (C) and PP (D). p > 0.05, two-way repeated ANOVA for weeks 4–12. p > 0.05, t-test for week 16 (recovery).

