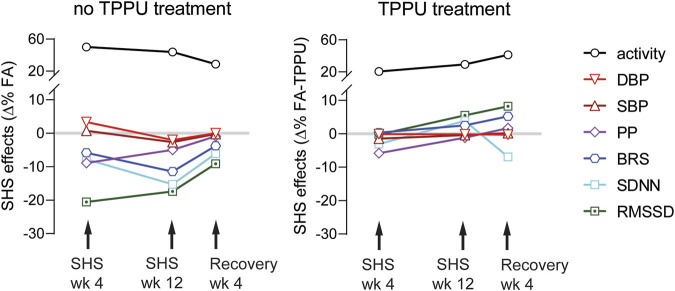
FIGURE 9.
Summary of SHS exposure effects. Data points are SHS readouts expressed as Δ% of their respective FA controls. SHS’s effects on RMSSD and PP had a faster onset with maximum effect at week 4. SDNN and BRS decreased over time with maximum reduction at week 12. BP was modestly increased at week 4, followed by a modest decrease at week 12. The activity levels were higher in the SHS exposed group. Changes in cardiovascular parameters showed recovery 4 weeks after cessation of SHS. Oral TPPU treatment during prevented SHS-induced cardiovascular consequences but not activity level.

