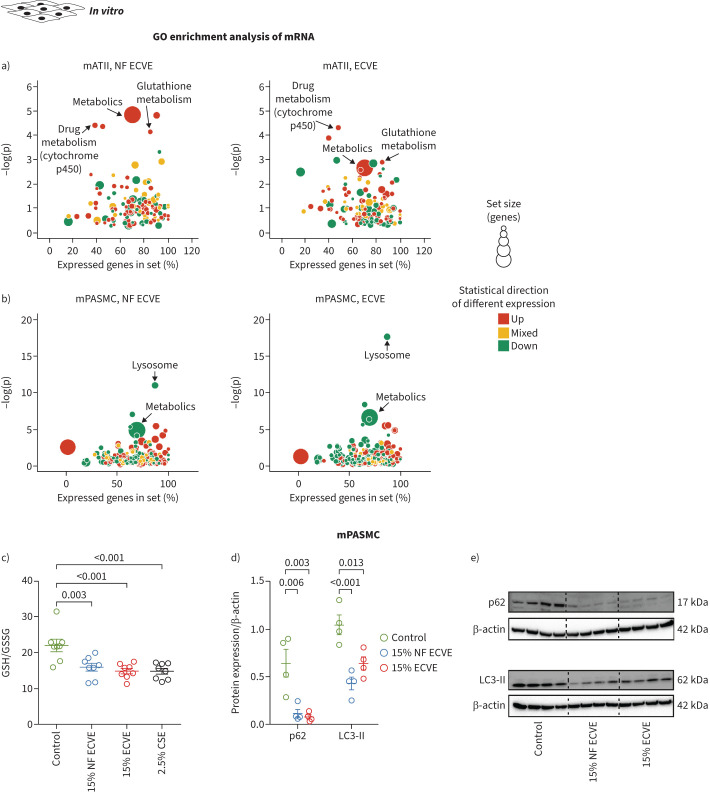
FIGURE 2.
The effects of nicotine-containing e-cigarette vapour extract (ECVE) or nicotine-free e-cigarette vapour extract (NF ECVE) on gene expression patterns, glutathione levels and protein expression of the autophagy-lysosome system. a, b) Gene ontology (GO) enrichment analysis of differentially expressed mRNA transcripts in primary mouse alveolar type II (mATII) cells (a) and primary mouse pulmonary arterial smooth muscle cells (mPASMCs) (b) exposed to either 15% NF ECVE or 15% ECVE. Bubble plots for enrichment analysis of GO terms are presented. The bubble areas indicate the number of genes in the sets, and the colour indicates if most of GO terms were upregulated (red) or downregulated (green). Yellow indicates that both up- and downregulated genes contribute to the enrichment (n=8). The y-axis (−log(p)) displays the significance level, the x-axis the percentage of expressed genes in the respective set of genes for a specific pathway. c) Ratio of reduced glutathione (GSH) to oxidised glutathione (GSSG) in primary mATII cells exposed to either 15% NF ECVE, 15% ECVE, 2.5% cigarette smoke extract (CSE) or control medium without ECVE, NF ECVE or CSE (n=8 each). d, e) Protein expression of p62 and microtubule-associated proteins 1A/1B light chain 3B (LC3-II), normalised to the expression of β-actin, in primary mPASMCs exposed to either 15% NF ECVE, 15% ECVE or control medium without ECVE or NF ECVE (n=4). Numbers represent independent isolations per group. For statistical analysis of c and d, one-way ANOVA with Tukey's post hoc test was used. Data are presented as mean±sem.

