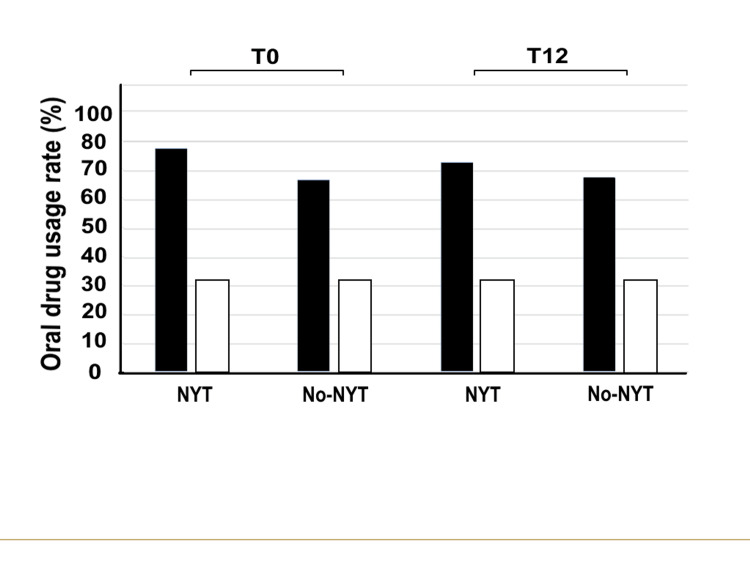
Figure 6. Oral OAB medication use rate in the two groups at T0 and T12.
The vertical axis represents the oral drug usage rate (%) and the horizontal axis highlights the NYT and no-NYT groups at T0 and T12. Patients in the NYT group (black bar) received NYT for one year, whereas those in the no-NYT group (white bar) did not receive NYT. T0 represents the first visit to our hospital by patients. T12 represents the 12th month of NYT use.
NYT, Ninjin'yoeito; OAB, overactive bladder

