
FIGURE 1.
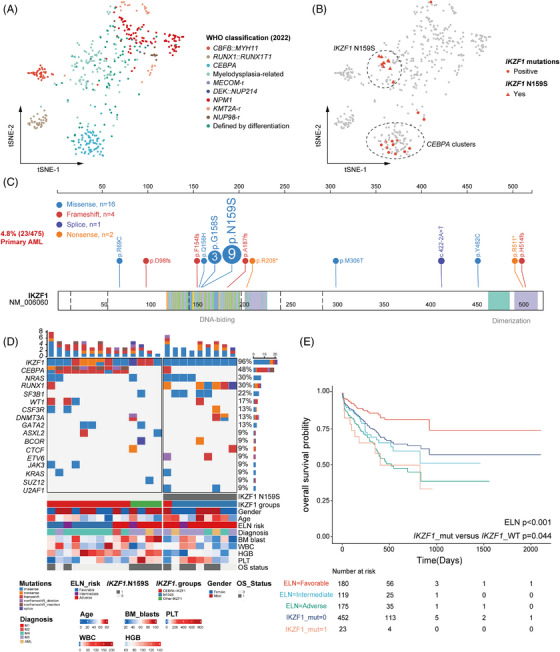
Genomic classification of IKZF1‐positive AML. (A) t‐SNE plots for the signatures of major somatic mutational WHO classes of our AML cohort. Each dot represents a cancer sample. Color of dots indicates cancer types or subtypes. (B) Expression clustering of representative markers for IKZF1 N159S, biCEBPA/‐like, and others AML are plotted onto the t‐SNE map. (C) Structure and mutation spectrum of IKZF1 in AML. All IKZF1 mutations (n = 23) are depicted in protein domains. Different colors represent different types of mutations. (D) Oncoplot and clinical features of patients with IKZF1 mutations. The heatmap shows the genomic landscape and clinical features of patients with IKZF1 mutations. (E) Overall survival of AML patients according to the ELN classes, Kaplan–Meier curves depicting the survival difference between IKZF1‐mutated patients and non‐IKZF1‐mutated patients.