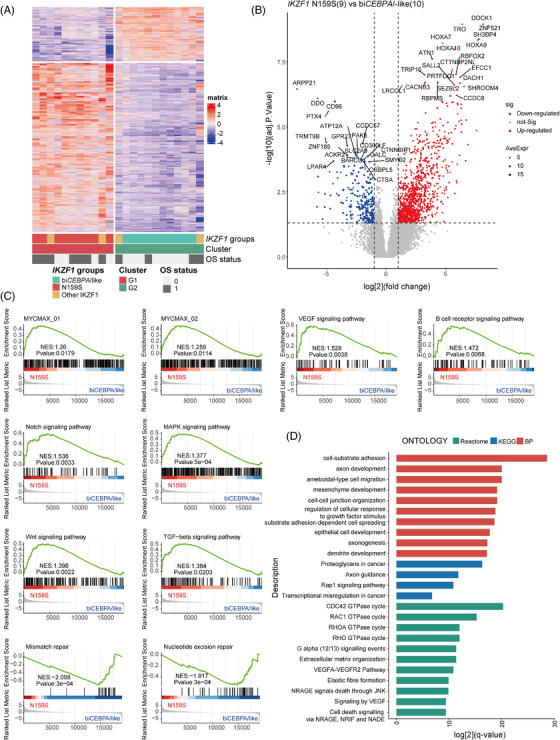
FIGURE 2.

IKZF1 N159S defines a rare molecular subtype with unique gene expression profiles in AML. (A) Unsupervised clustering using the 1267 variance genes with p value less than 0.05 among three classes of classifications in IKZF1‐positive AML. Each column represents a patient and each row represent a gene. Up‐ and downregulated genes are shown in red and blue, genomic‐based classification in IKZF1‐positive AML patients demonstrated that IKZF1 N159S and biCEBPA/‐like were pertained to two different subgroups, which we defined as G1 and G2, respectively. (B) Volcano plot shows the differentially expressed genes (DEGs) between IKZF1 N159S and biCEBPA/‐like cases. The x axis represents log2‐transformed fold‐change values, while y axis shows –log10‐transformed p value. (C) Gene set enrichment analysis of IKZF1 N159S patients (versus biCEBPA/‐like). (D) Significant positive enrichment of terms in IKZF1 N159S‐positive AML.
