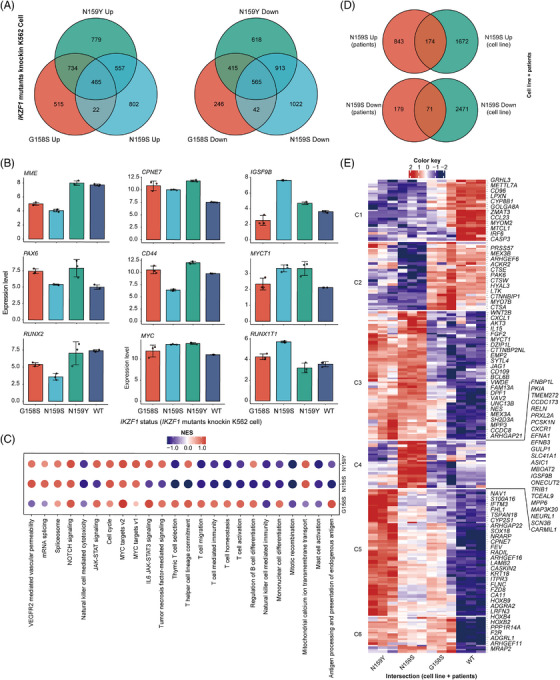
FIGURE 4.

Bulk RNA‐Seq analysis of IKZF1 WT, G158S, N159S and N159Y knock‐in human cell lines define codrivers of IKZF1 N159S‐positive AML. (A) Venn diagram depicting the relationship of differentially up‐ and downregulated expressed genes (DEGs) between IKZF1 G158S, N159S and N159Y mutation knock‐in K562 cell line (versus WT). (B) Bar plots showing the expression level of 9 selected DEGs in the RNA‐Seq data. (C) Dot plot detailing the enriched pathways of IKZF1 G158S, N159S and N159Y mutation knock‐in K562 cell line. (D) Venn diagram depicting the relationship of differentially expressed genes (DEGs) between IKZF1 N159S‐positive AML and IKZF1 N159S knock‐in K562 cell line. (E) Heatmap showing the hierarchical clustering of IKZF1 G158S, N159S and N159Y mutation knock‐in K562 cell line (versus WT) based on DEGs intersection of IKZF1 N159S‐positive AML and IKZF1 N159S knock‐in cell. Gene signatures of IKZF1 N159S can be divided into six subclasses, namely, C1–C6. These subclusters of genes are enriched in WT, WT/G158S, N159Y/S, N159S and N159Y, respectively.
